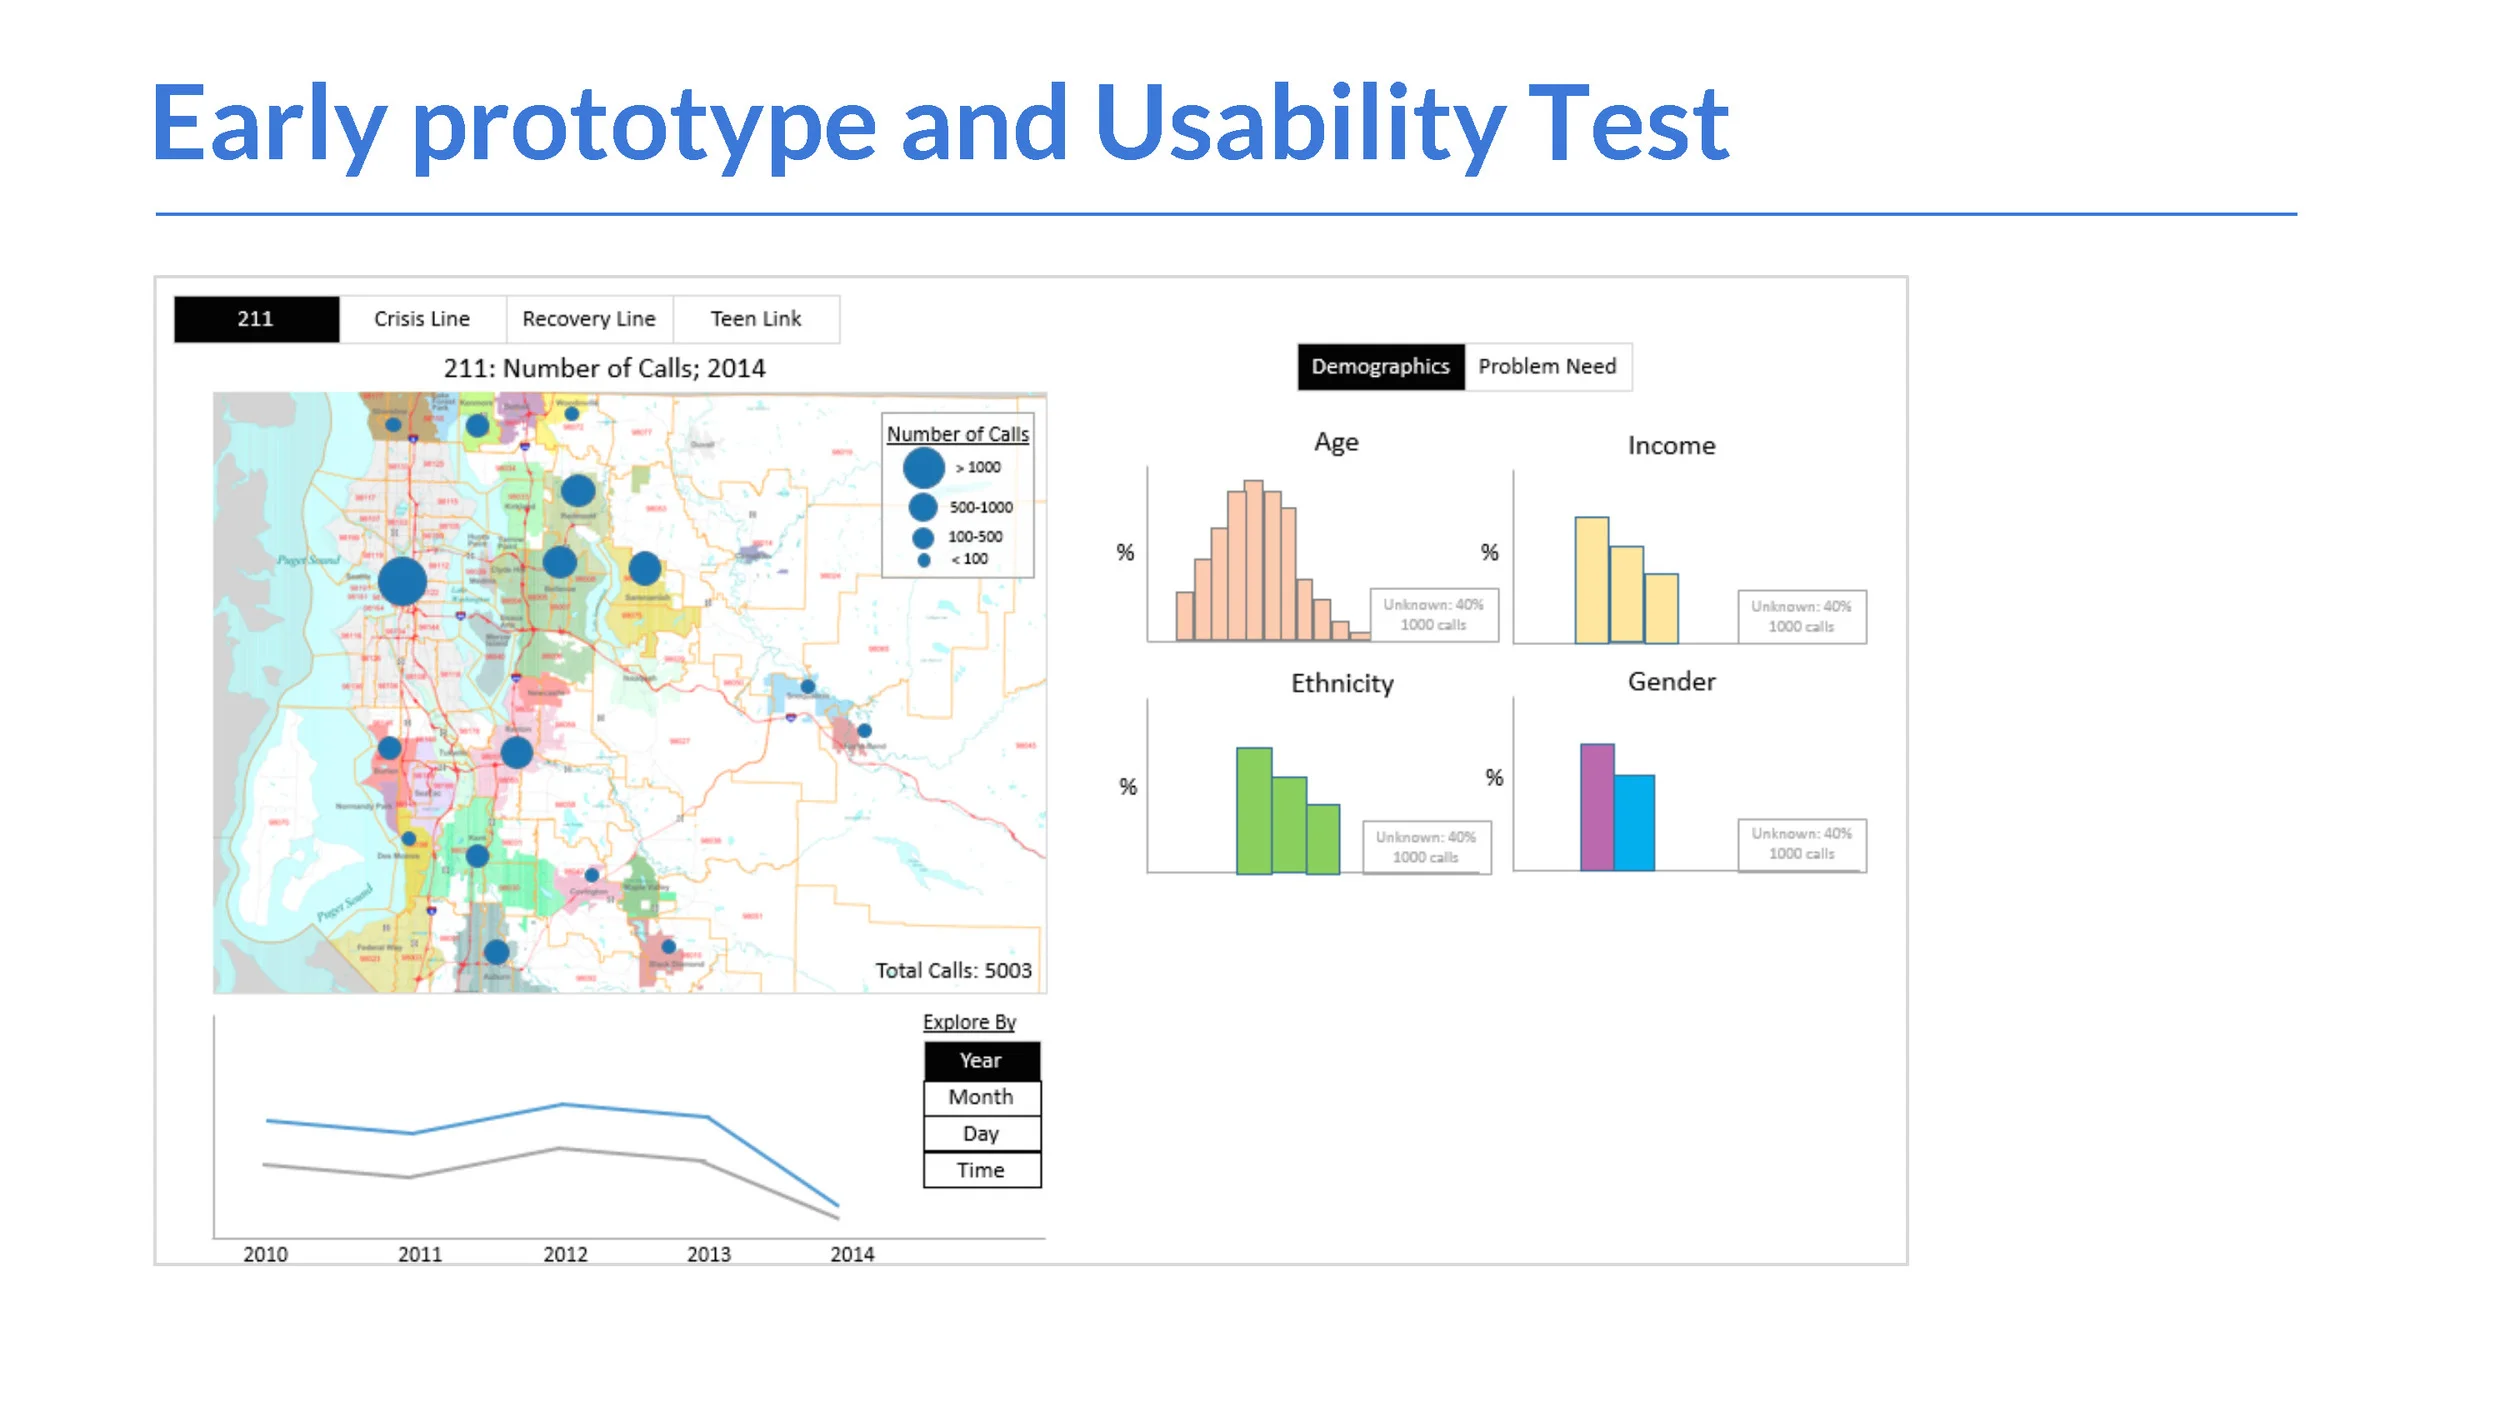
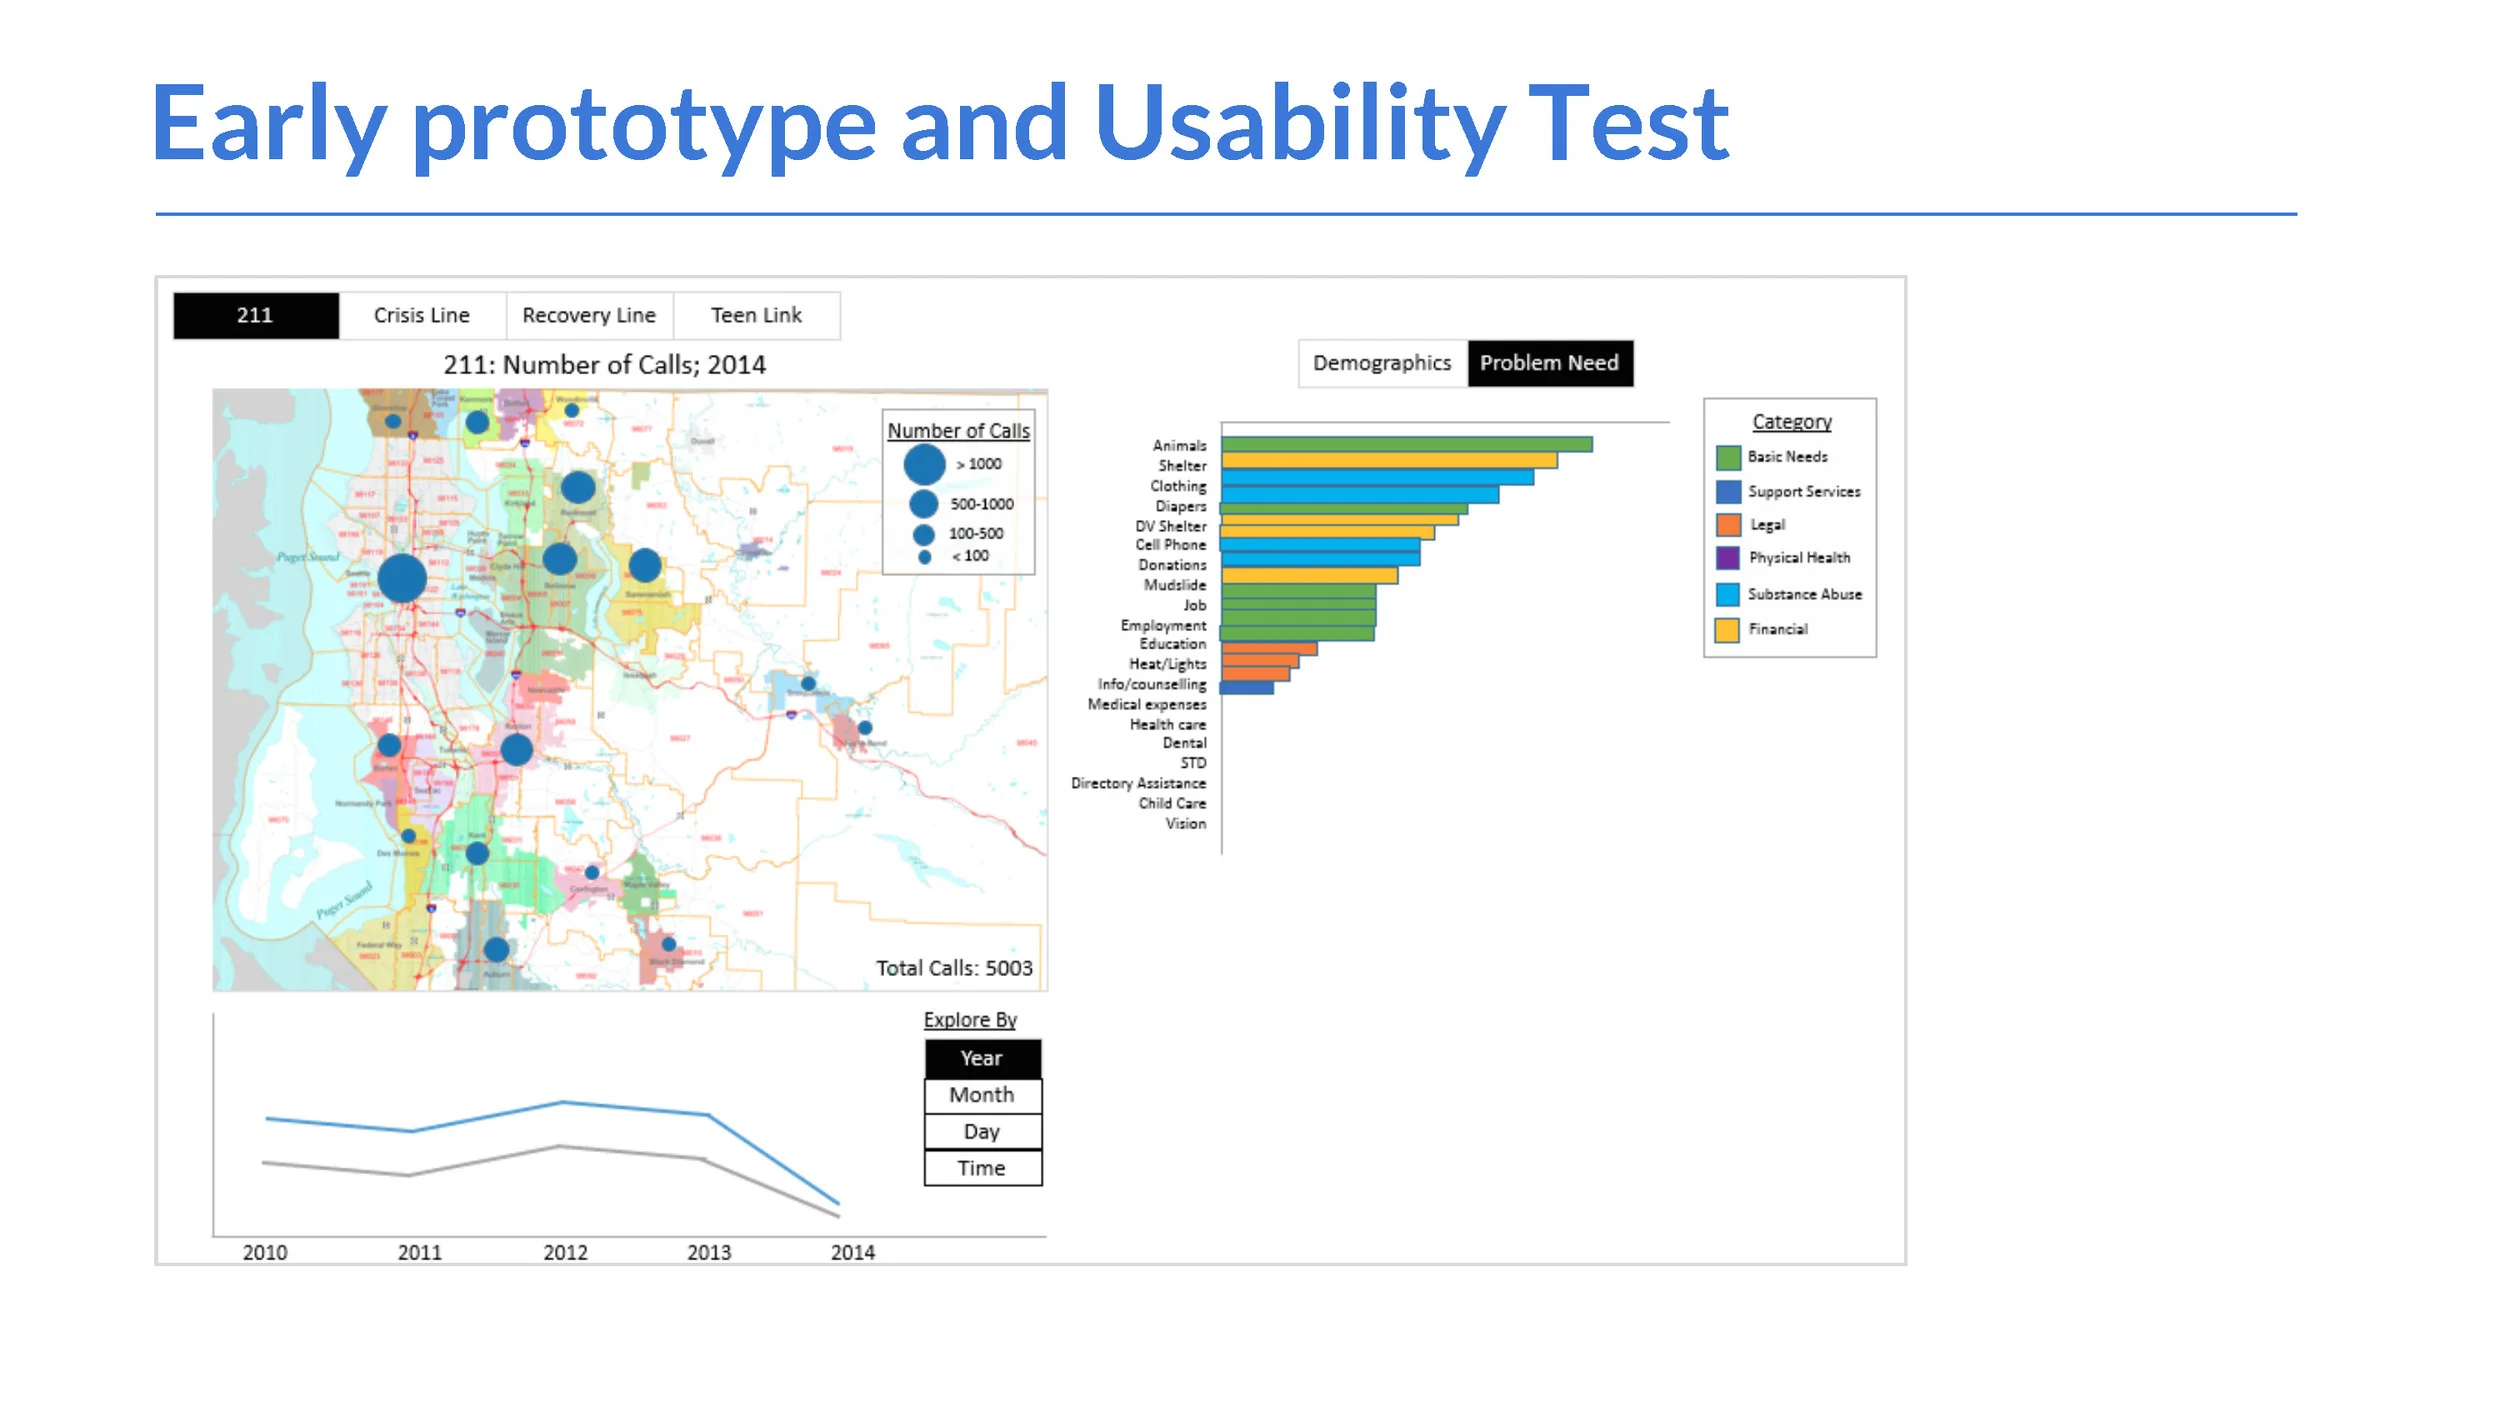
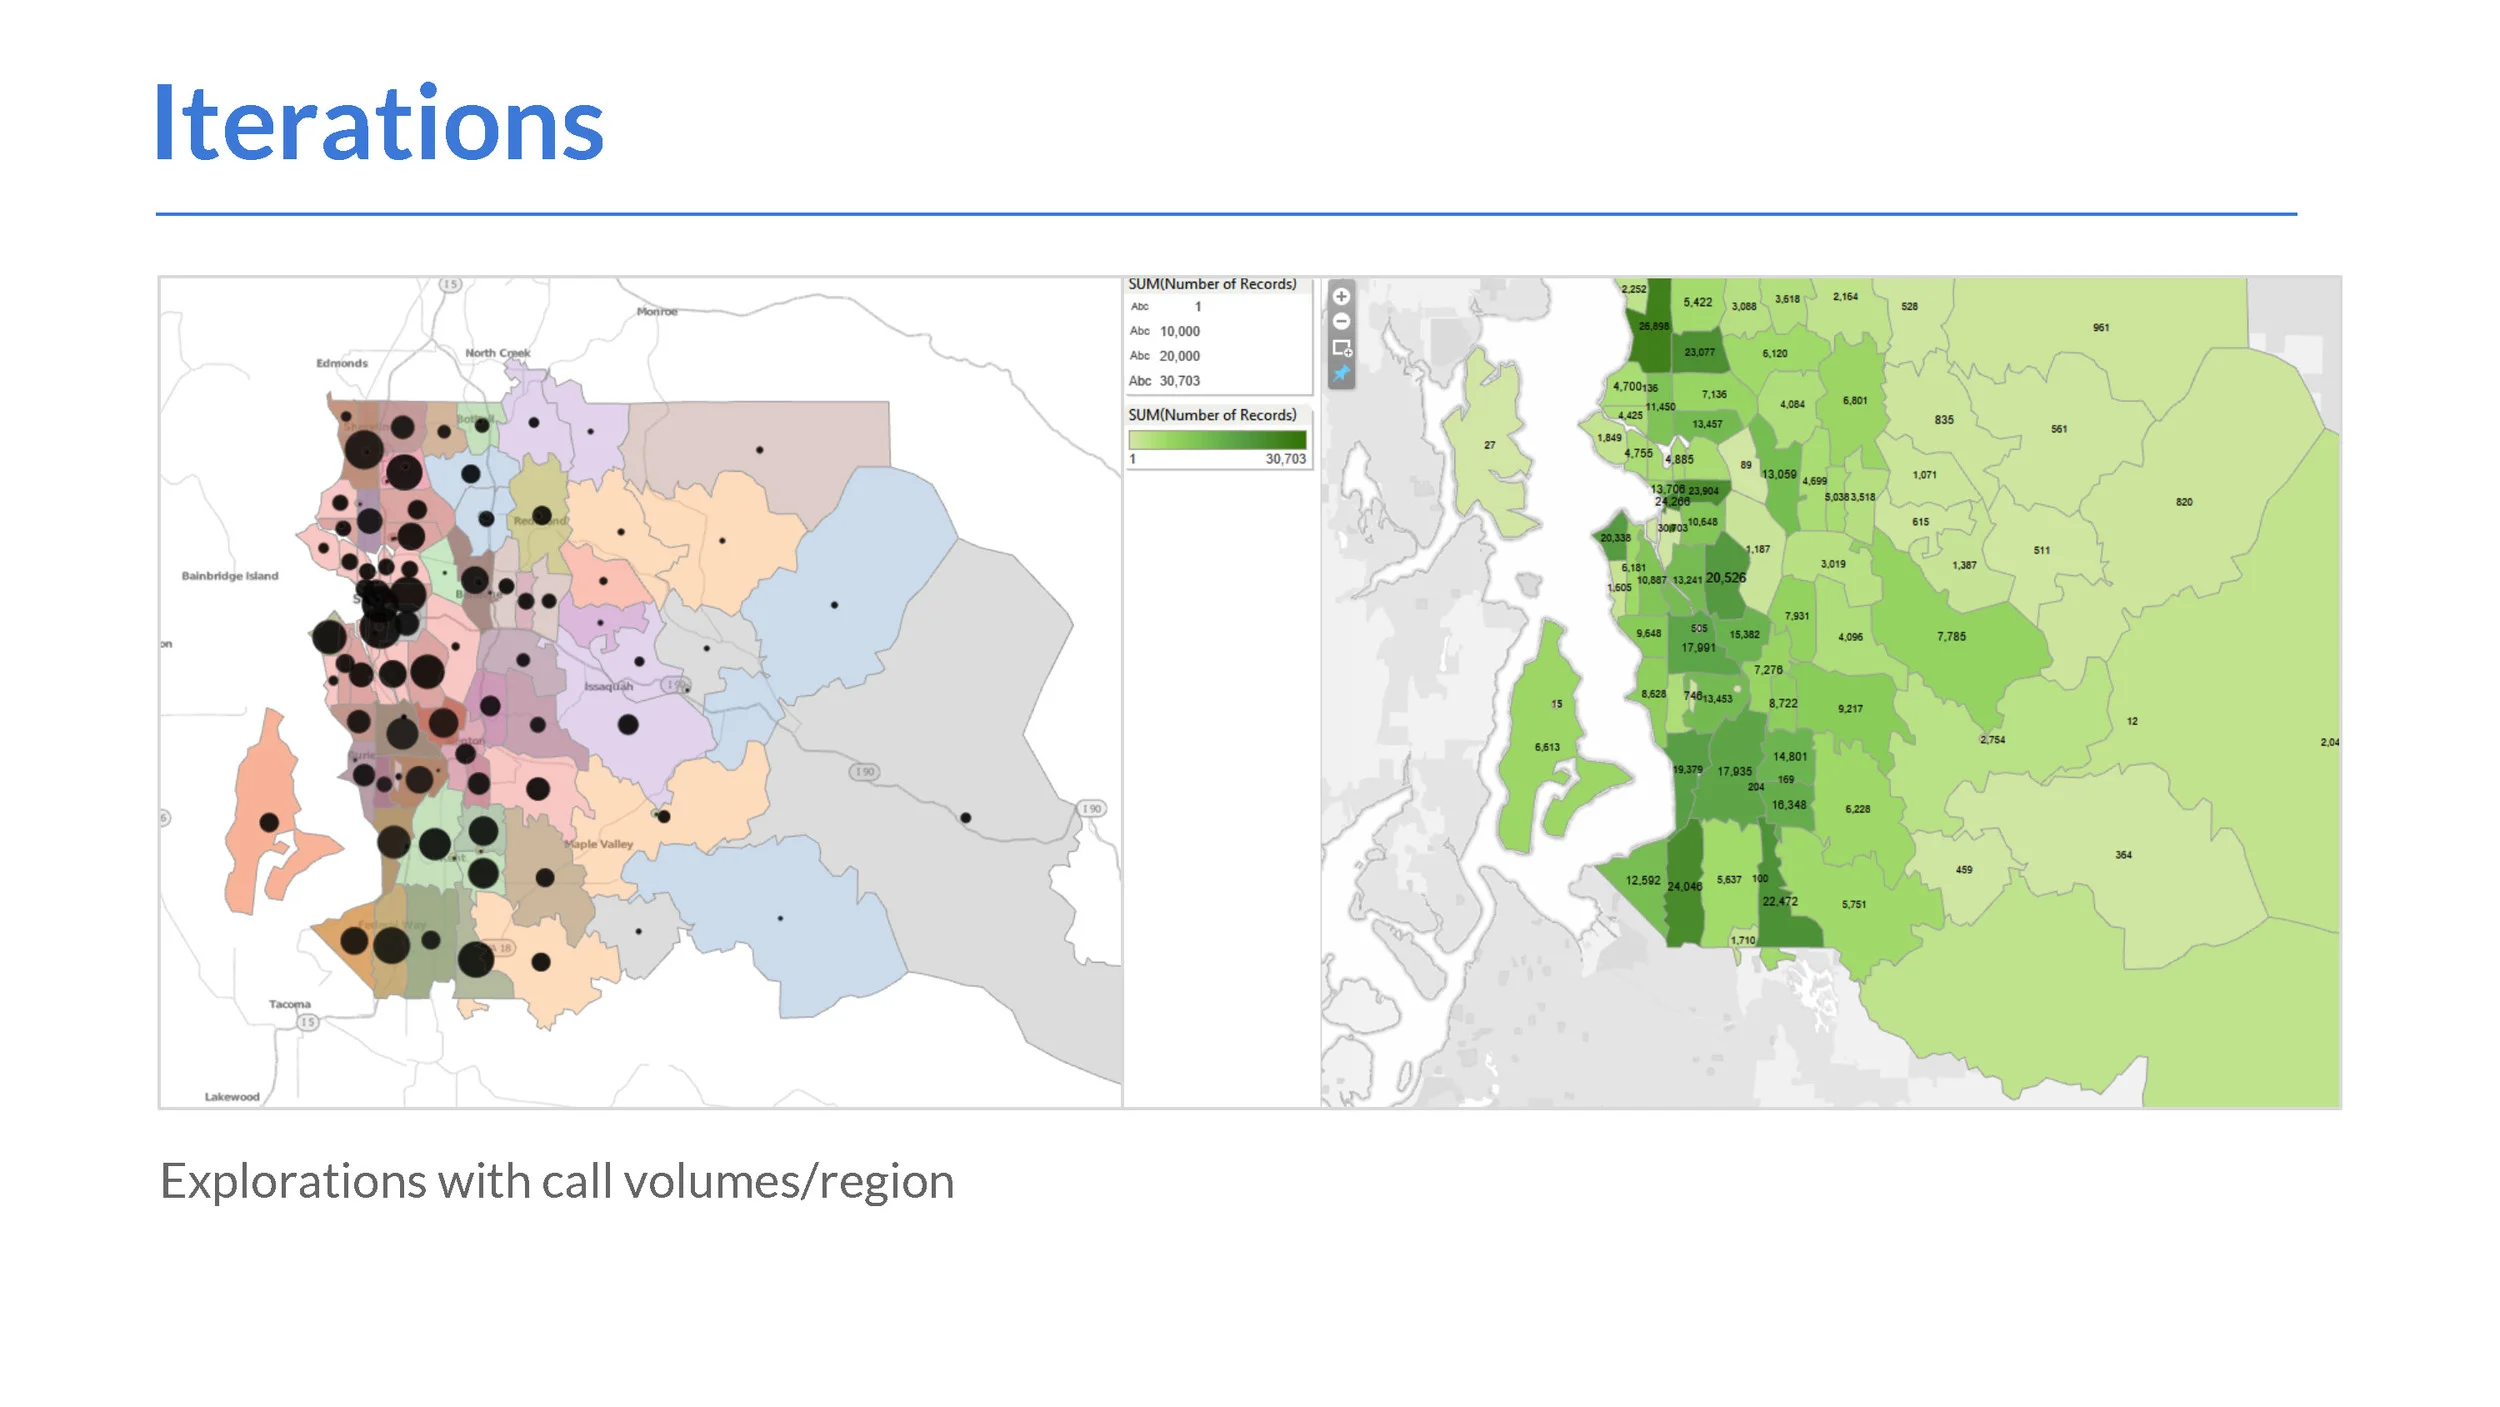
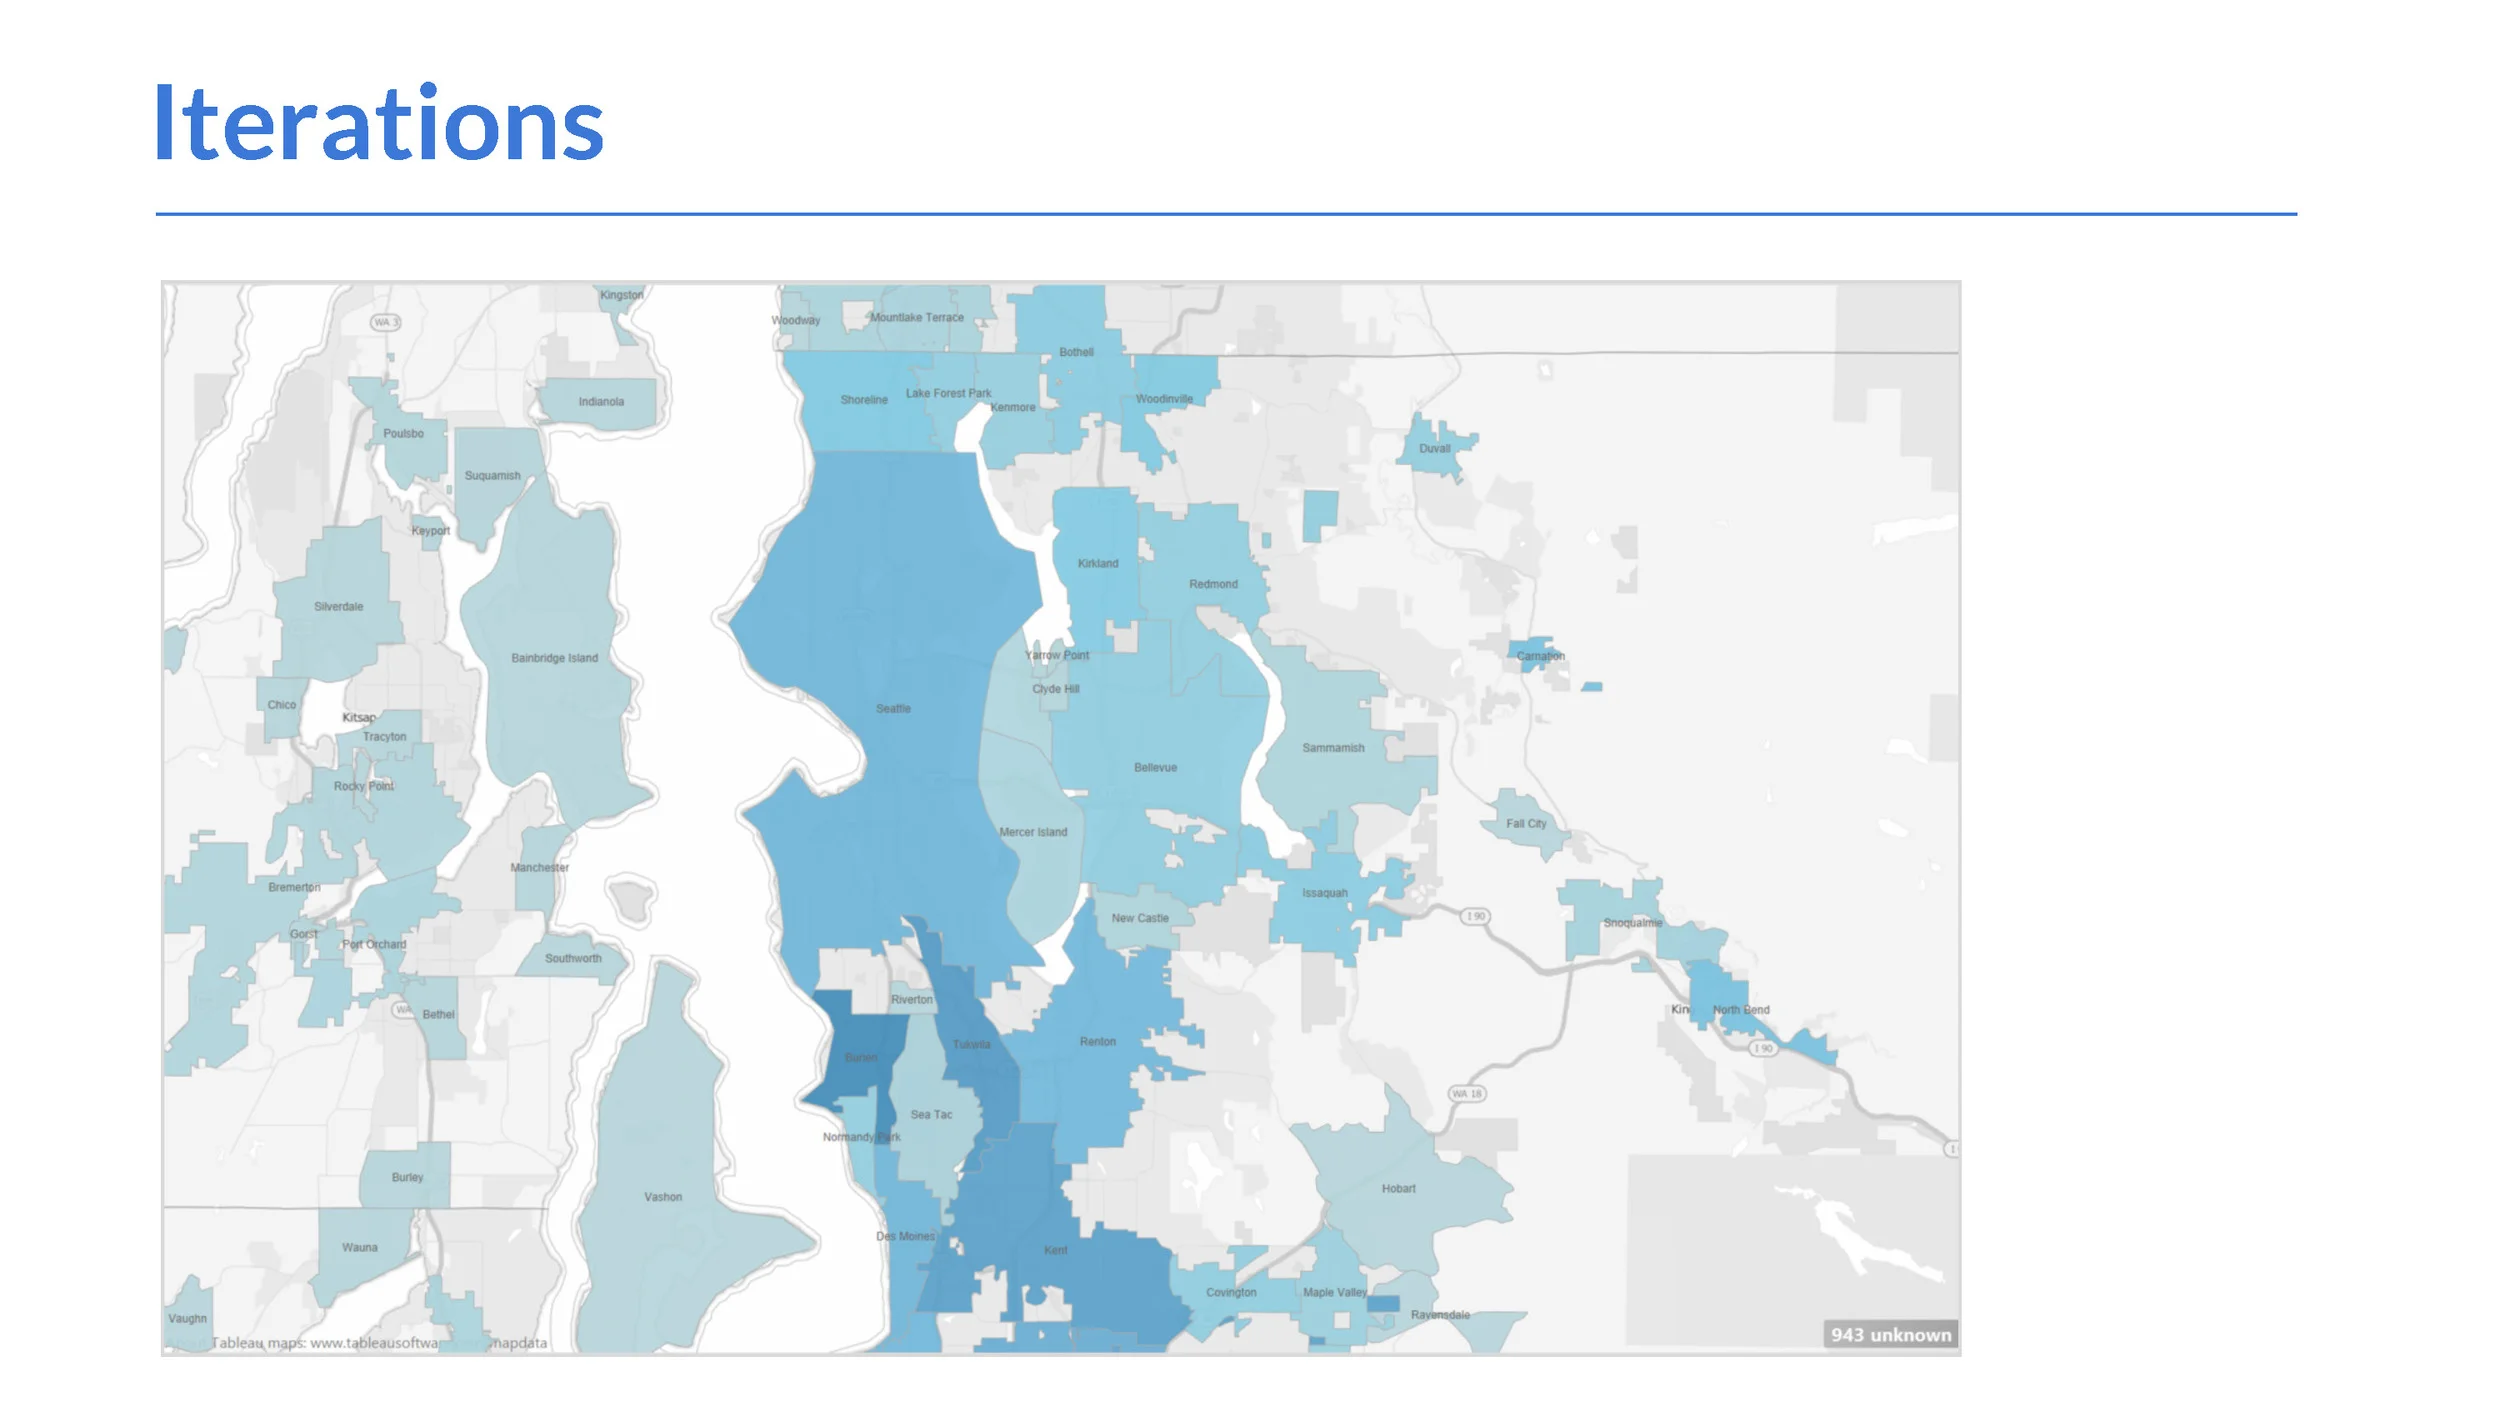
Version used for the third usability test. The encoding by size of bubbles was later replaced by encoding by color value on choropleth based on usability results
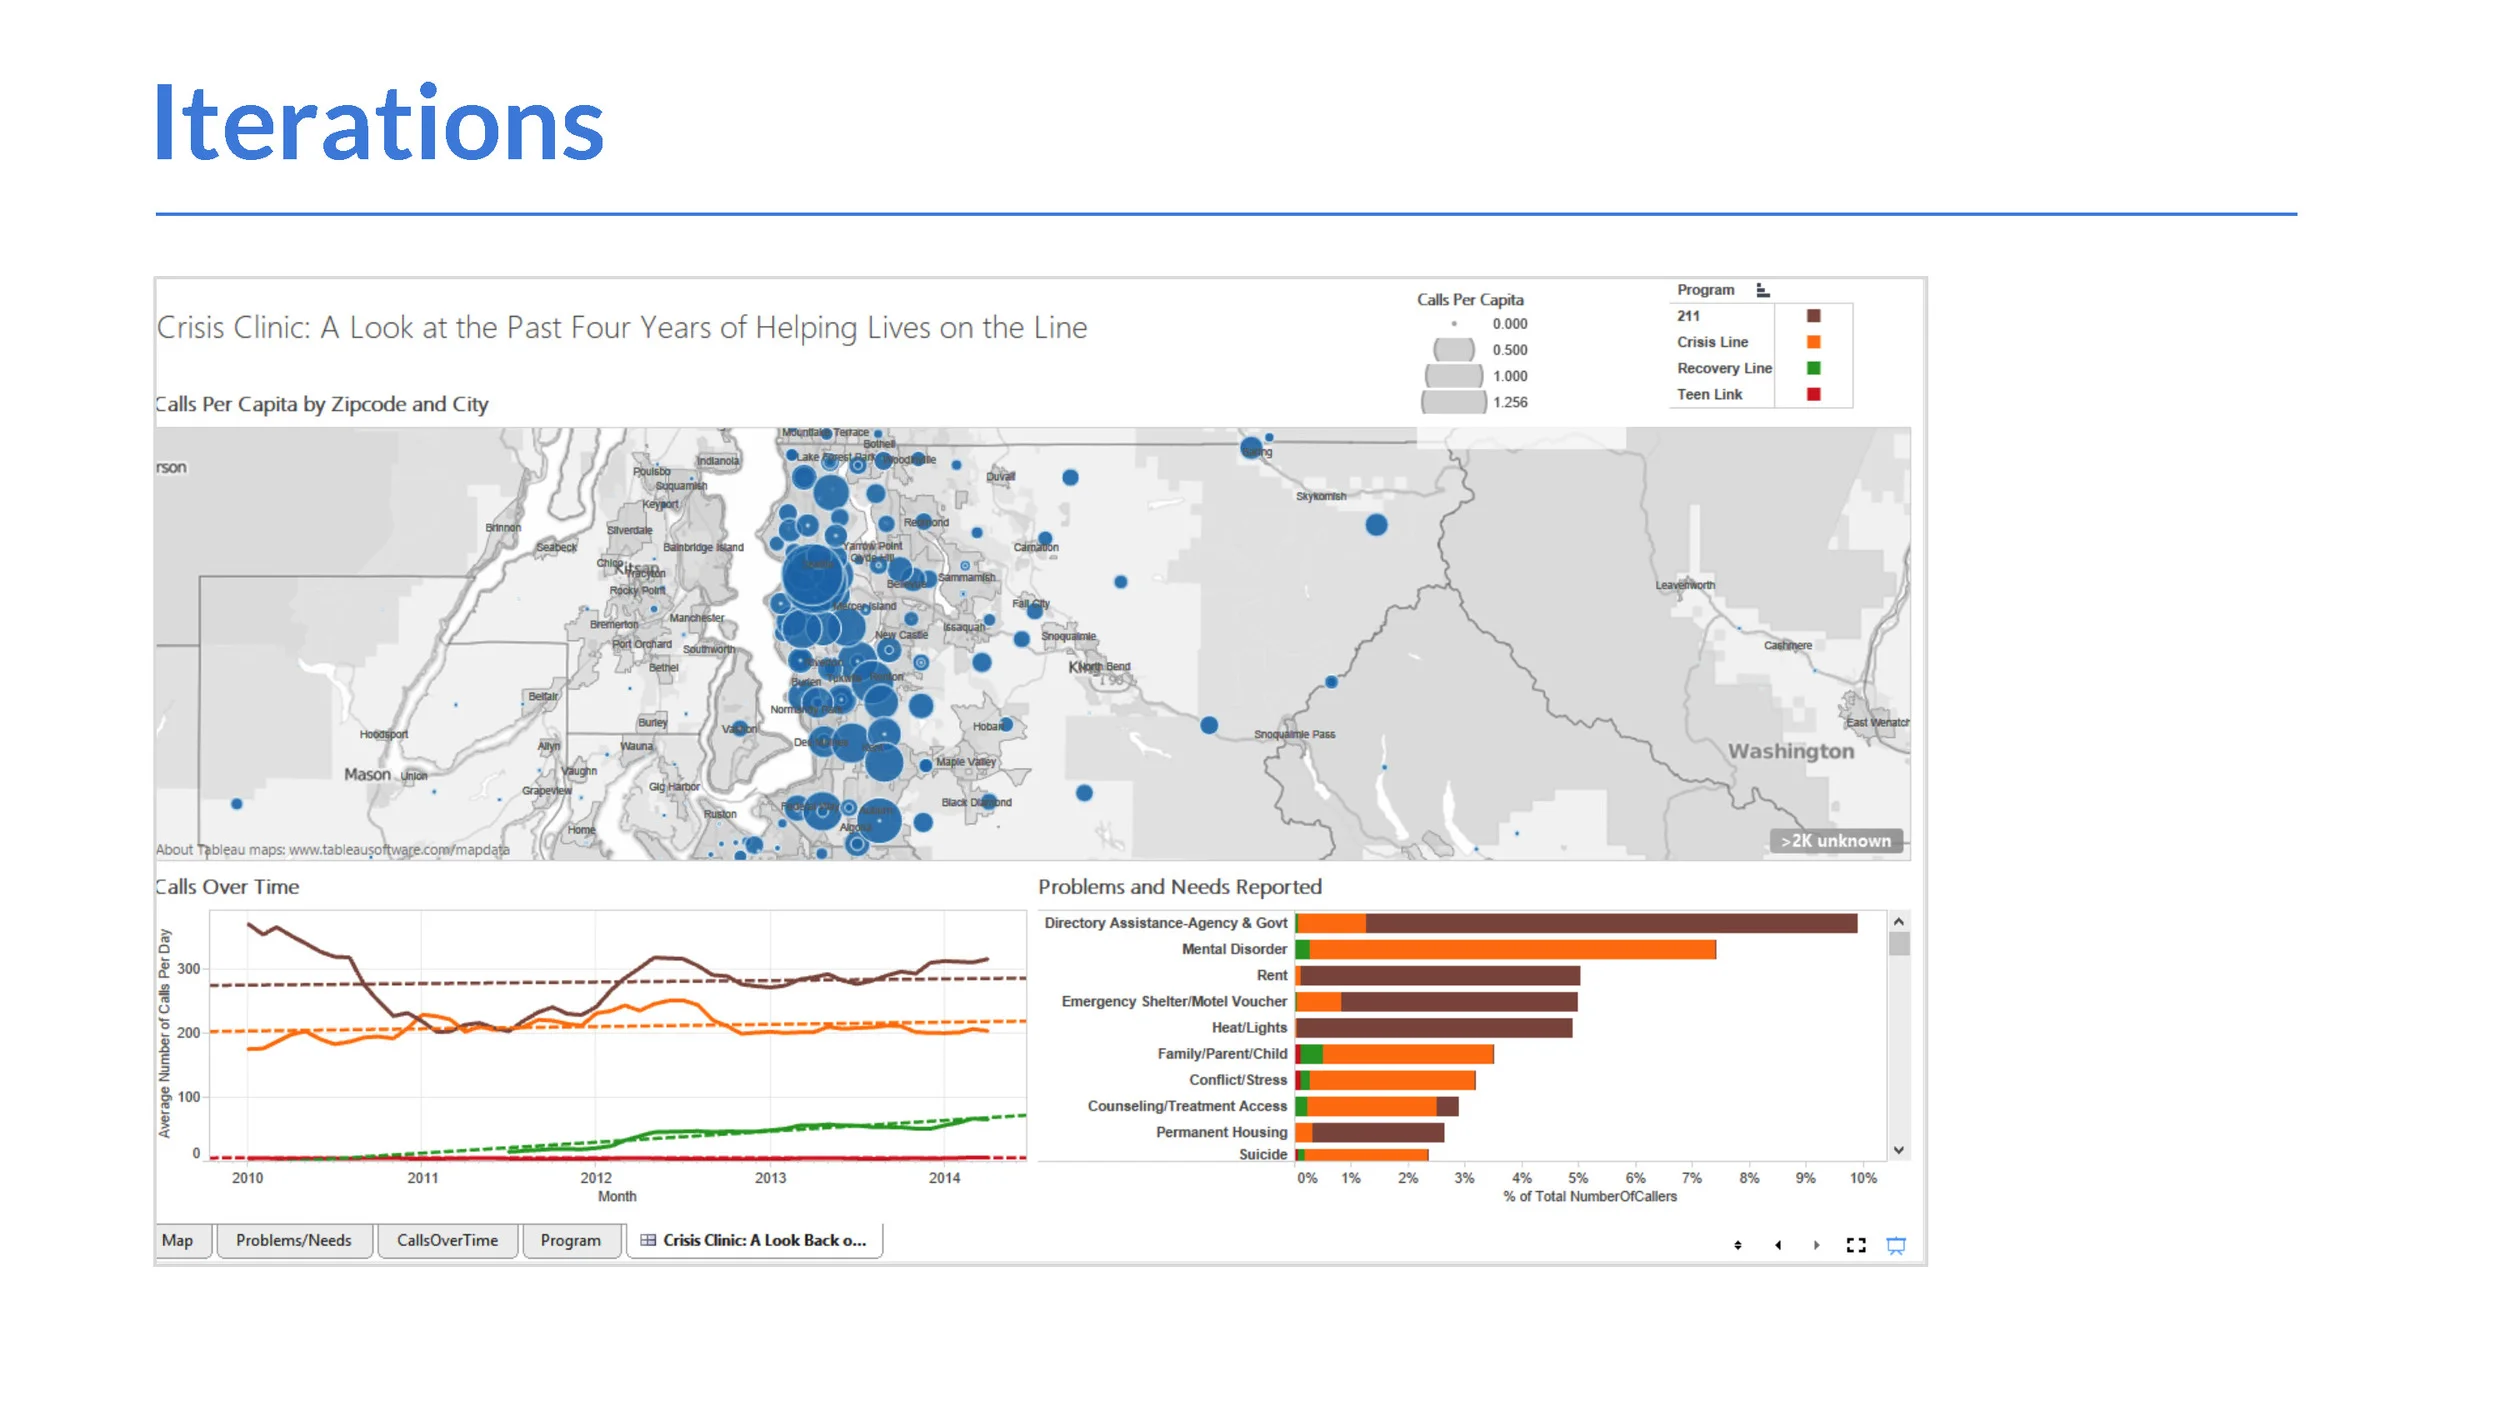
Final dashboard in tableau
Filtered by time span and specific line i.e. teen link. Brushing and linking changes each graph.
Crisis Clinic: Visualizing the past four years of helping lives on the line
Collaborators: Abhigyan Kaustubh, Emily Greenberg, Lana Pledger
METHODS AND SKILLS
Exploratory Data Analysis, Interactive Data Visualization, Interaction Design, User Testing
BACKGROUND
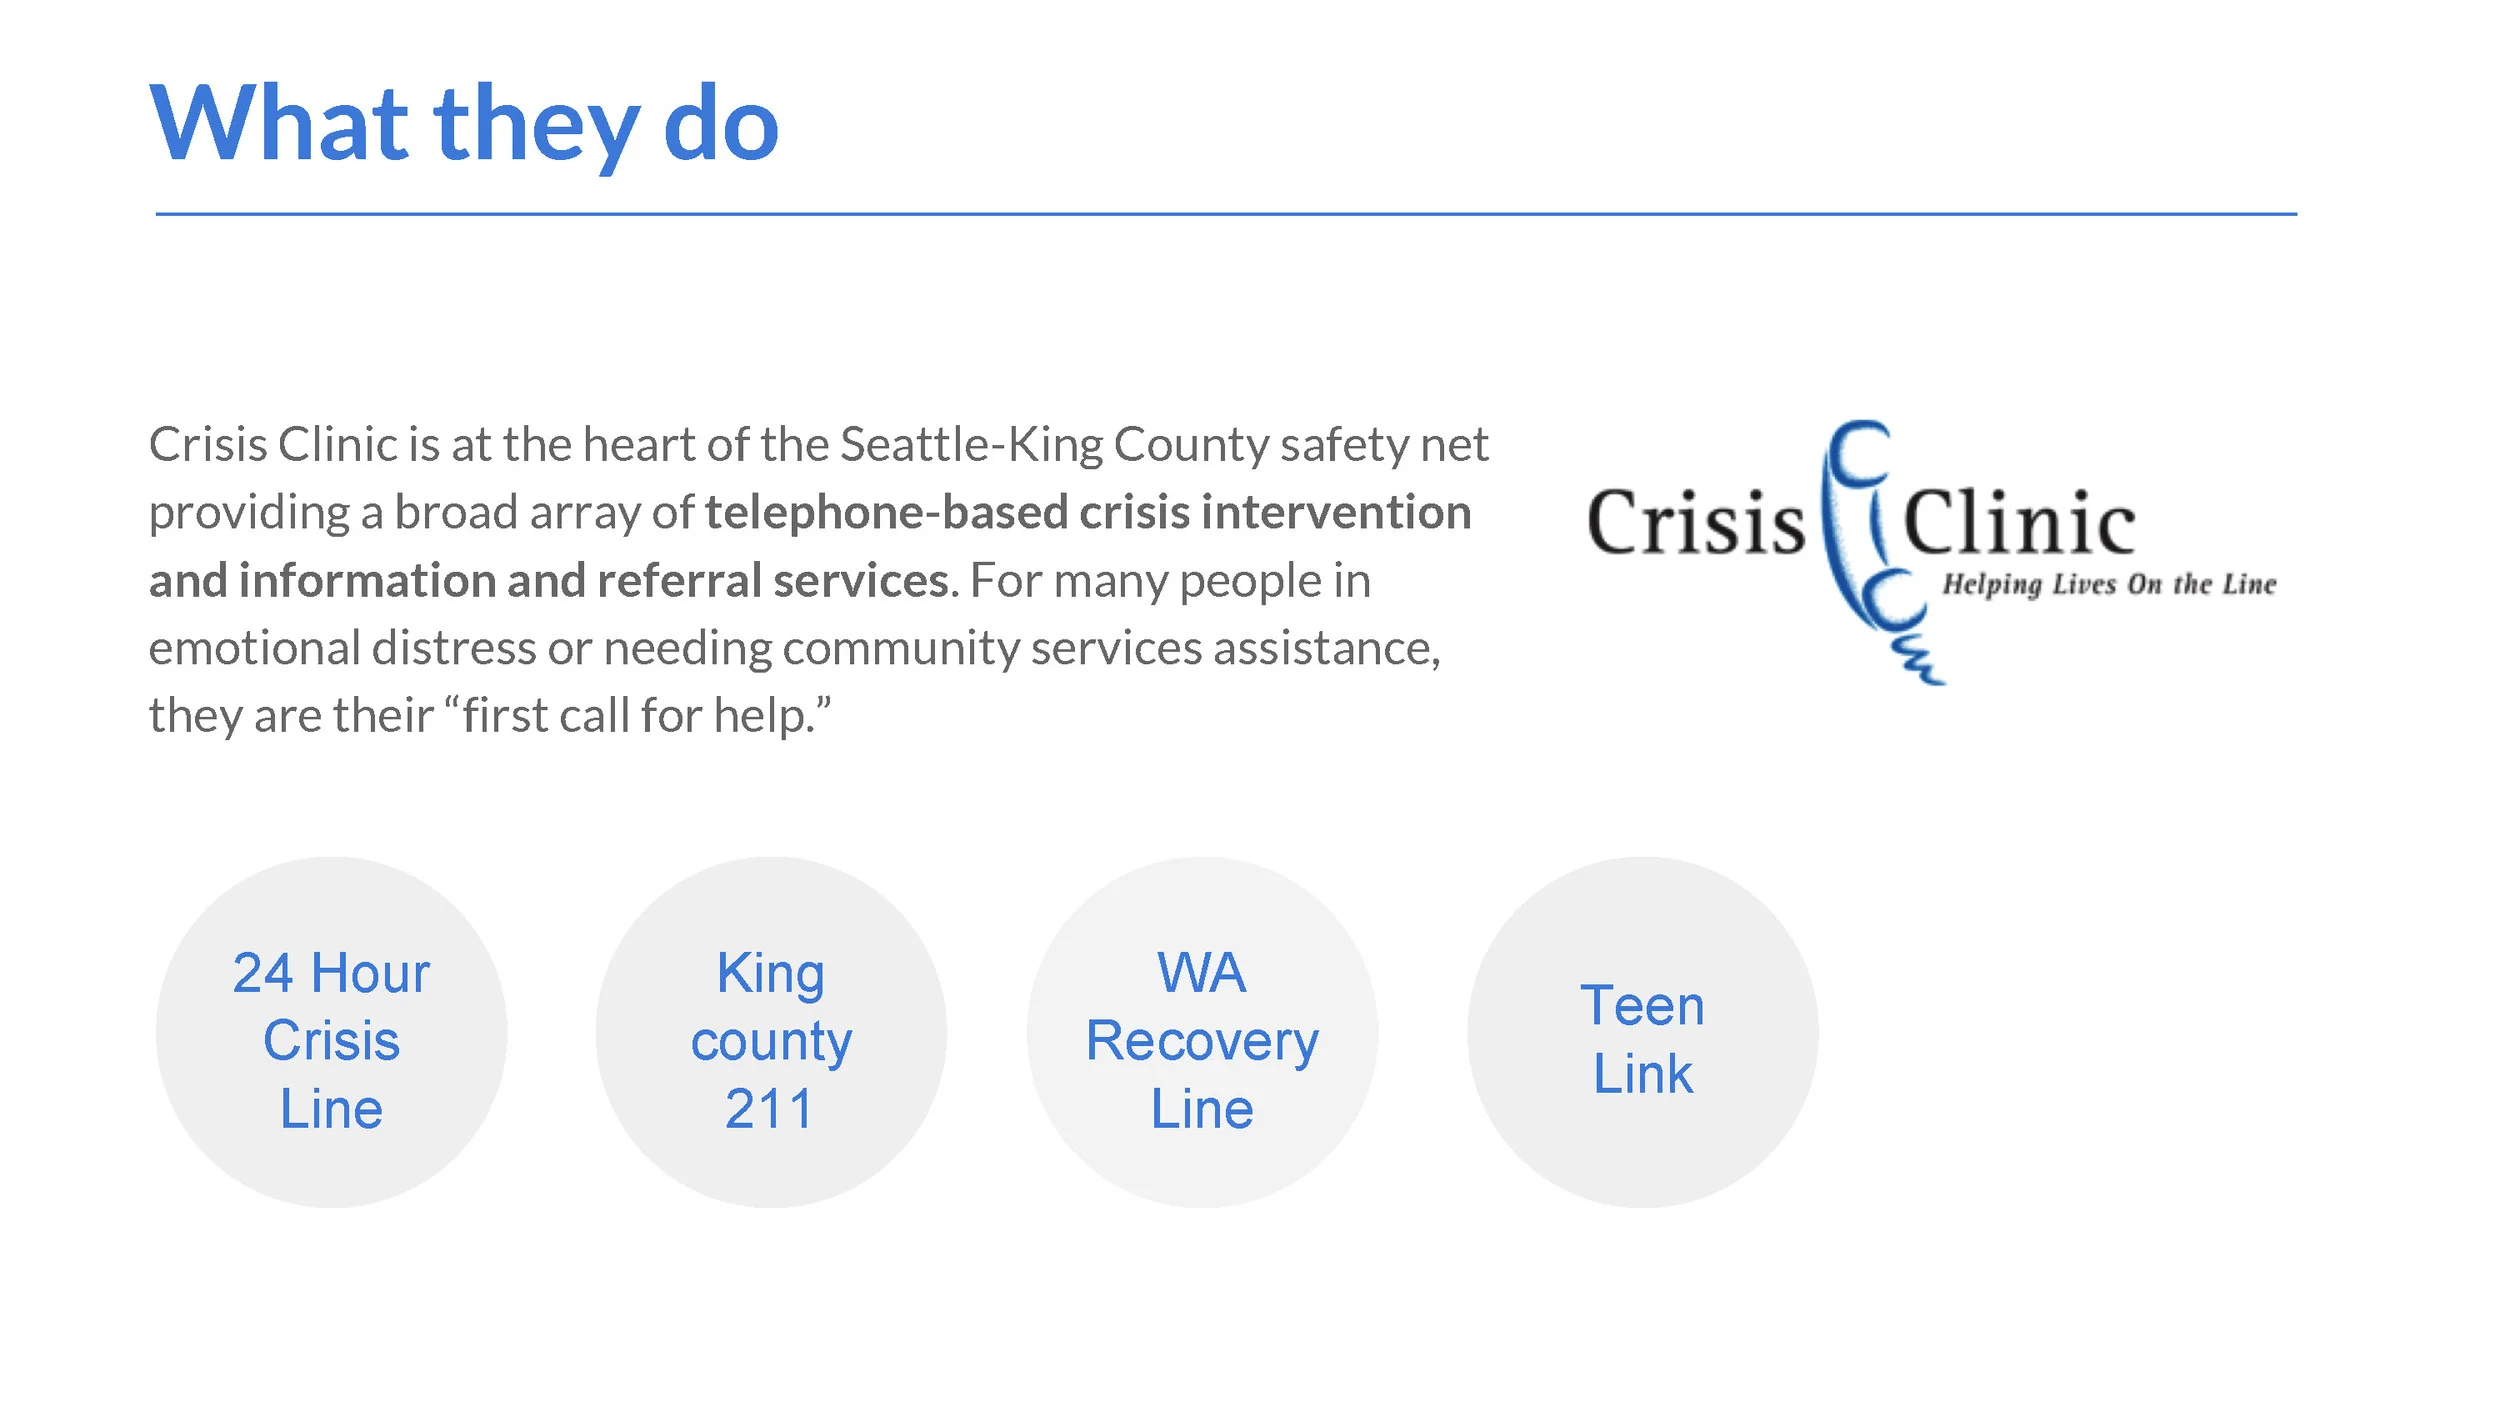
Crisis Clinic is a Seattle-King County based organization providing a broad array of telephone-based crisis intervention, information and referral services. They have four main programs through which they receive a huge number of calls from residents.
Through this project we investigate the different ways of making interactive visualizations of the callers’ dataset to gain insights into its presence in the King County area, and understand patterns in the calls they receive across geography and time. We envision that these insights will allow the staff at Crisis Clinic to better allocate resources in a targeted way, more effectively communicate the impact of Crisis Clinic to current and prospective funders, and allow the general public to better understand and appreciate its work in the King County area.
PROCESS
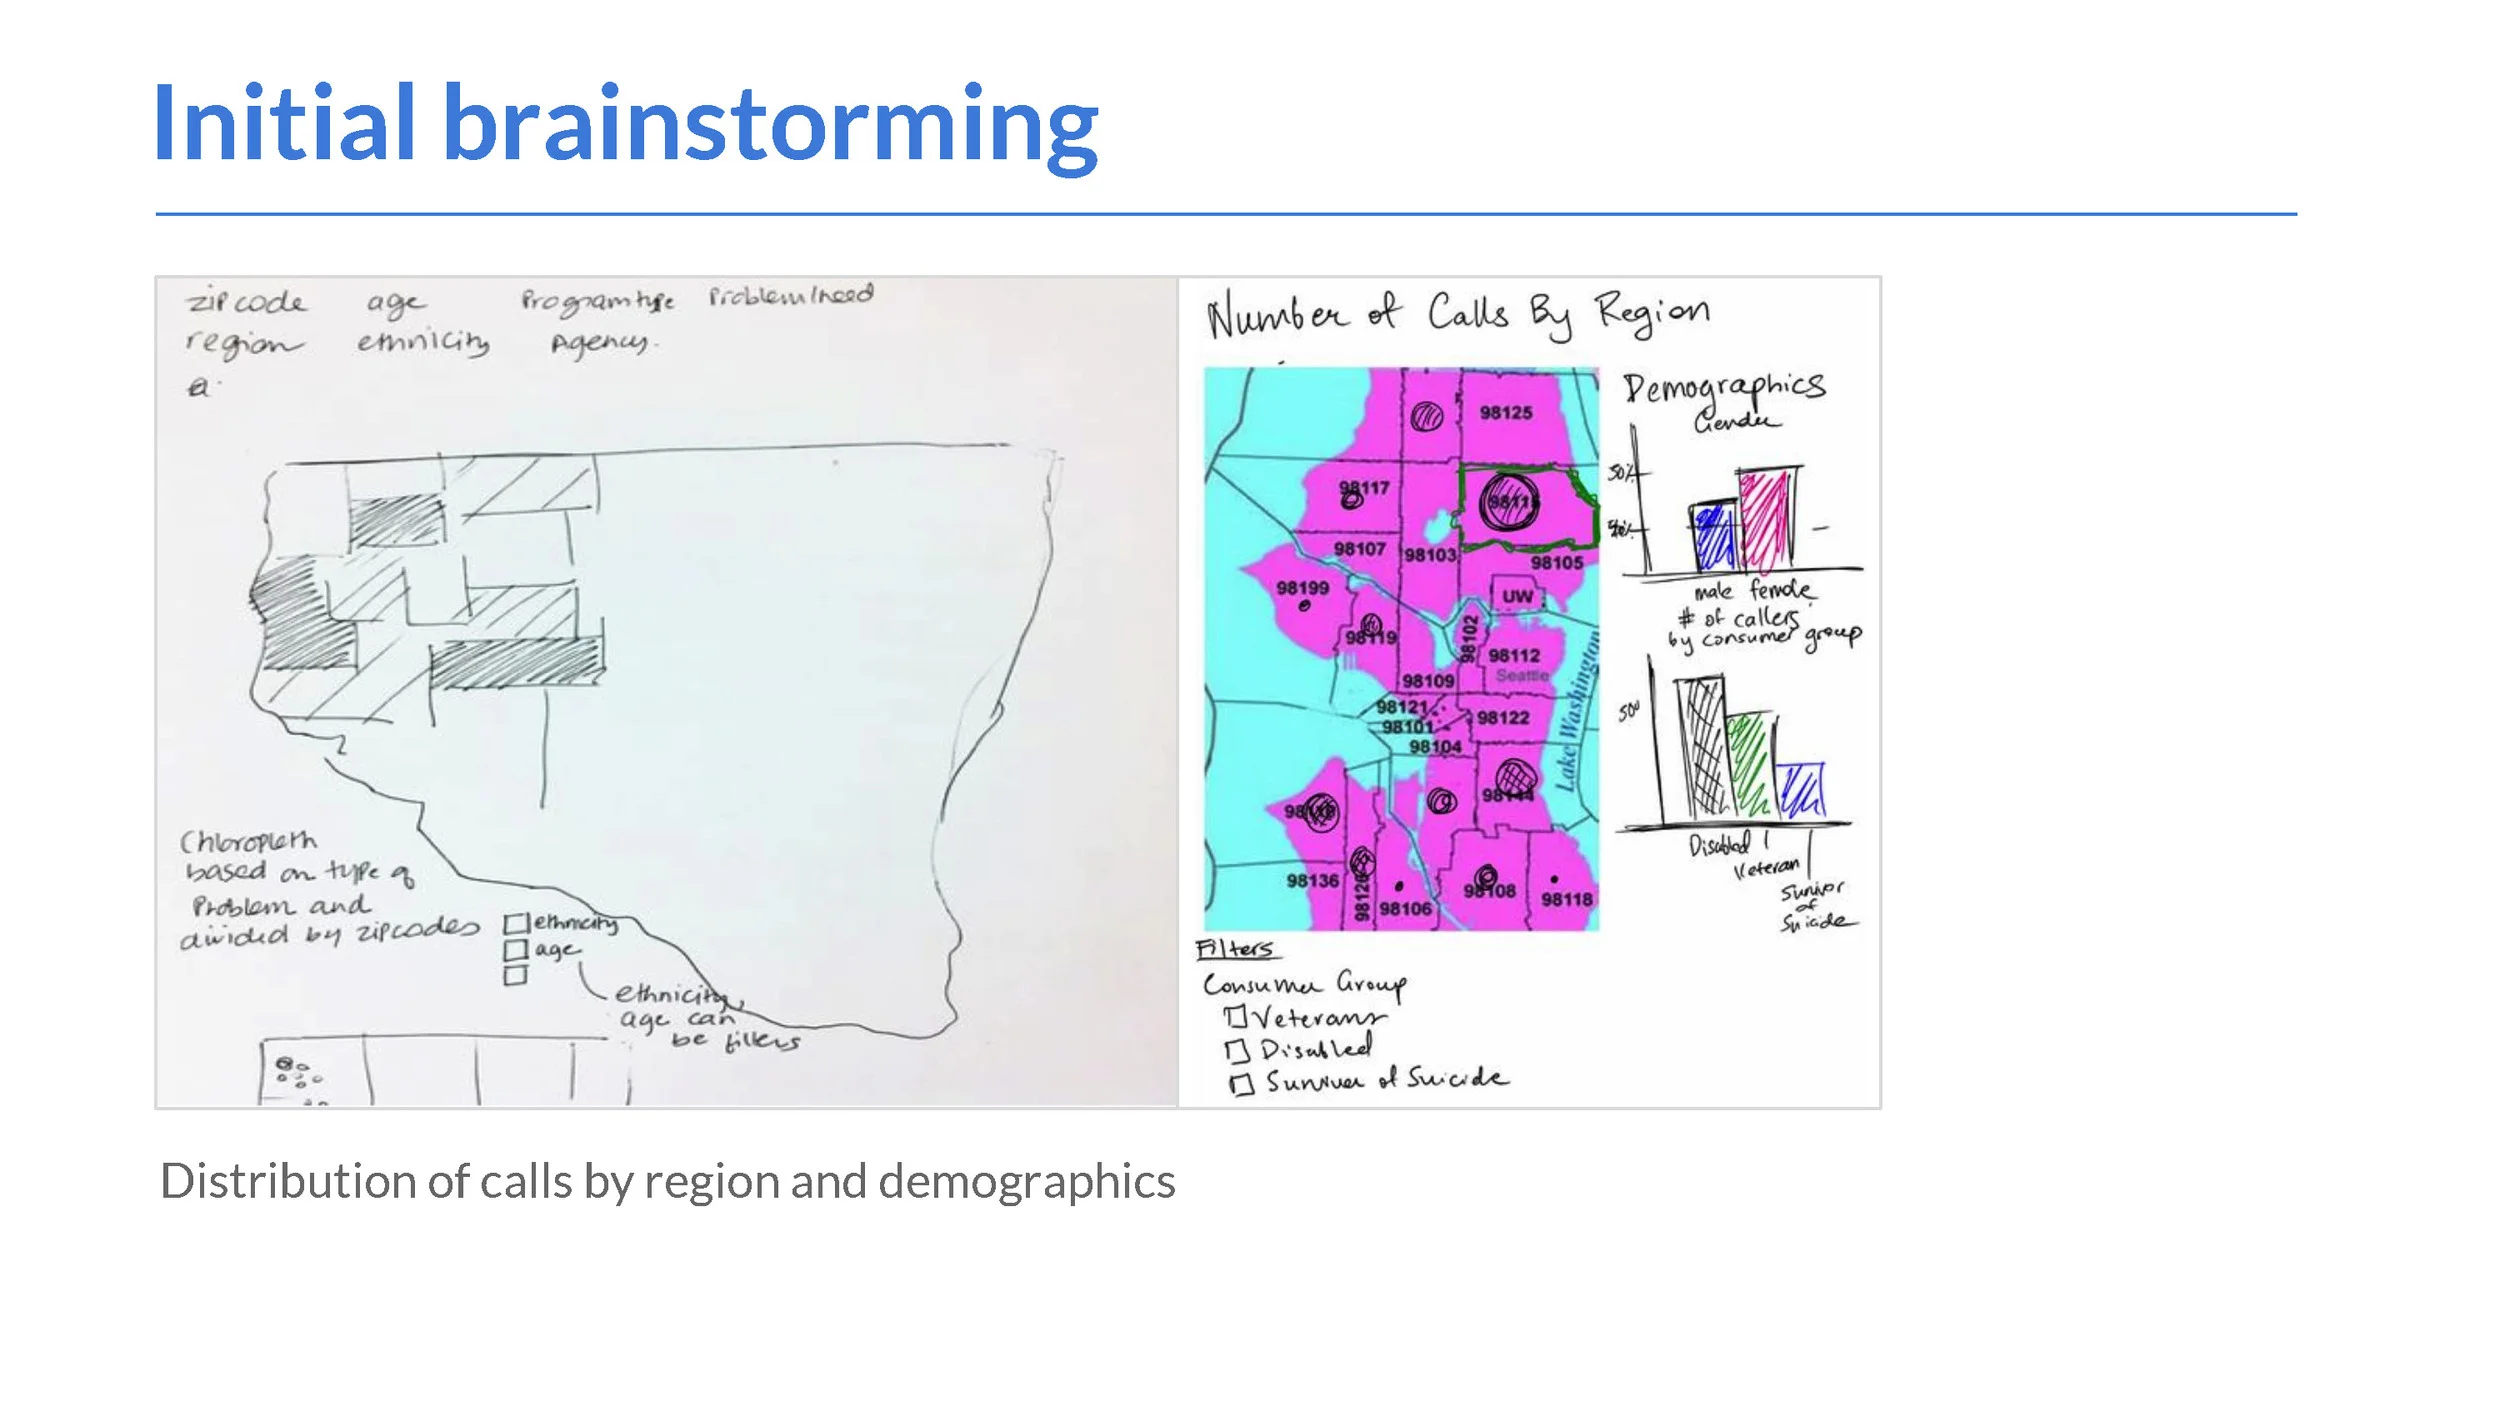
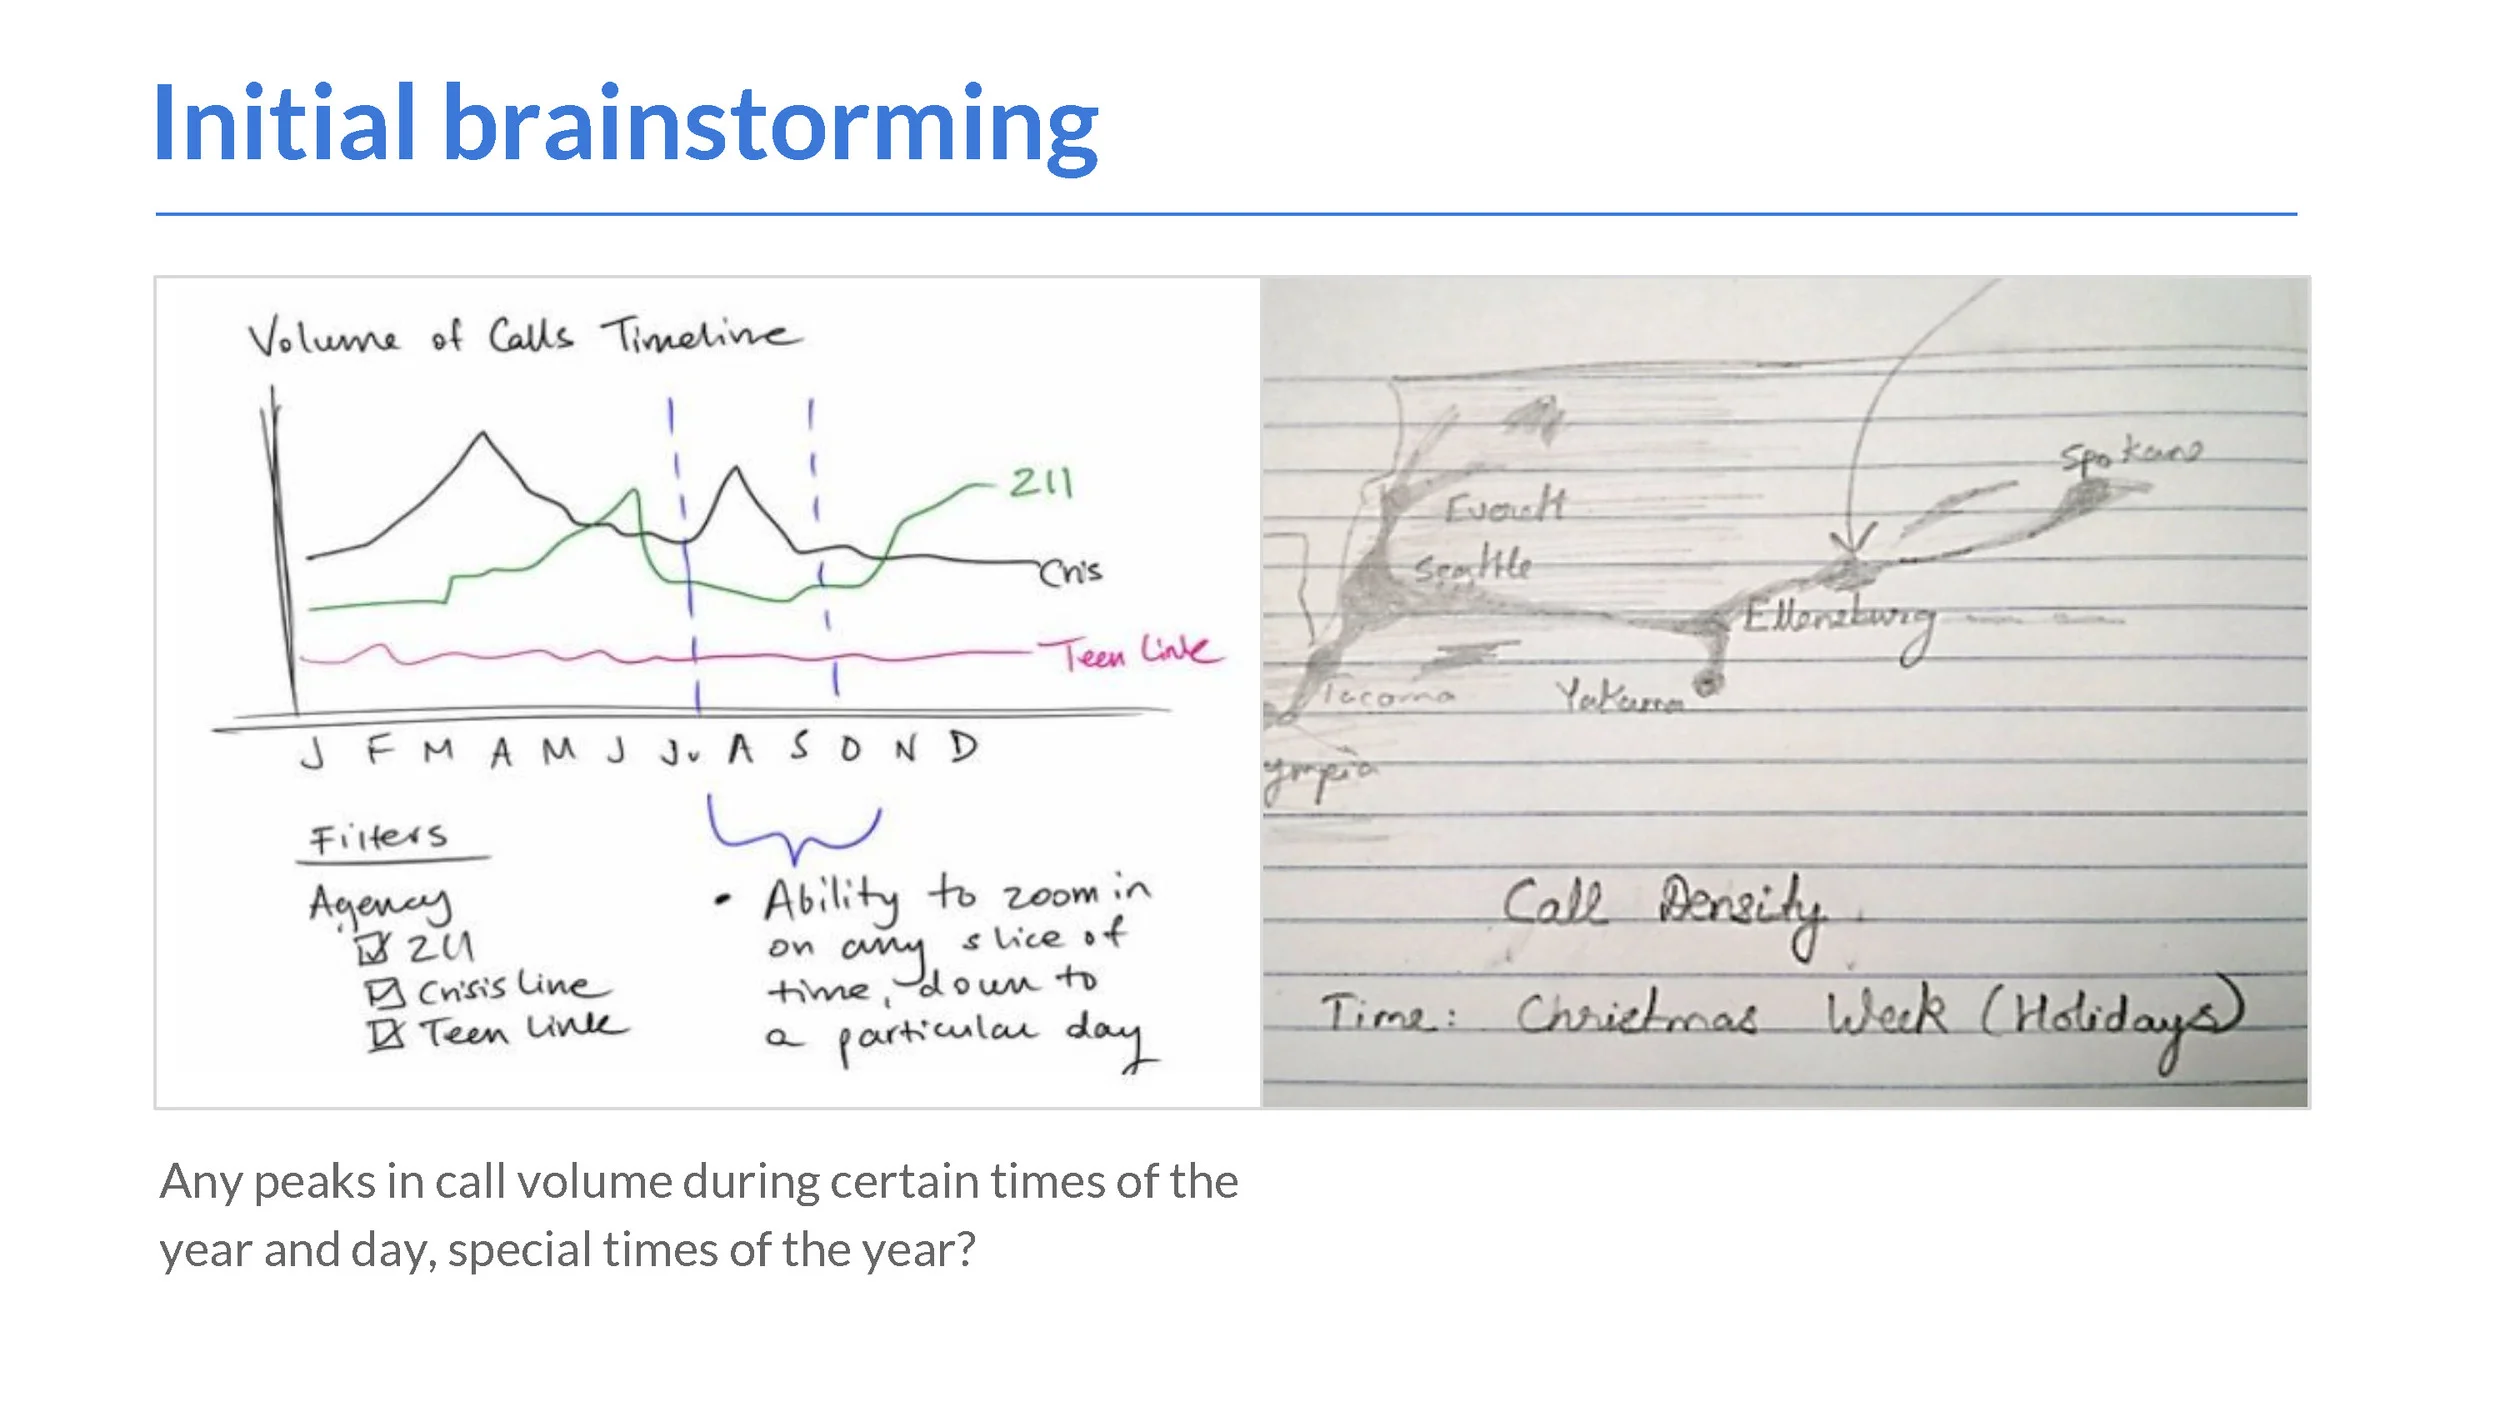
Early in our process, we interviewed the Crisis Clinic staff to get an overview of their needs. We started with sketches and consolidated them into creating an early mid-fidelity prototype to test with our prospective users. This prototype evolved into an interactive implementation in Tableau, which was further refined based on usability testing. We went through three rounds of iterations and usability testing in which the users were asked to complete tasks and the visualization was improved accordingly.
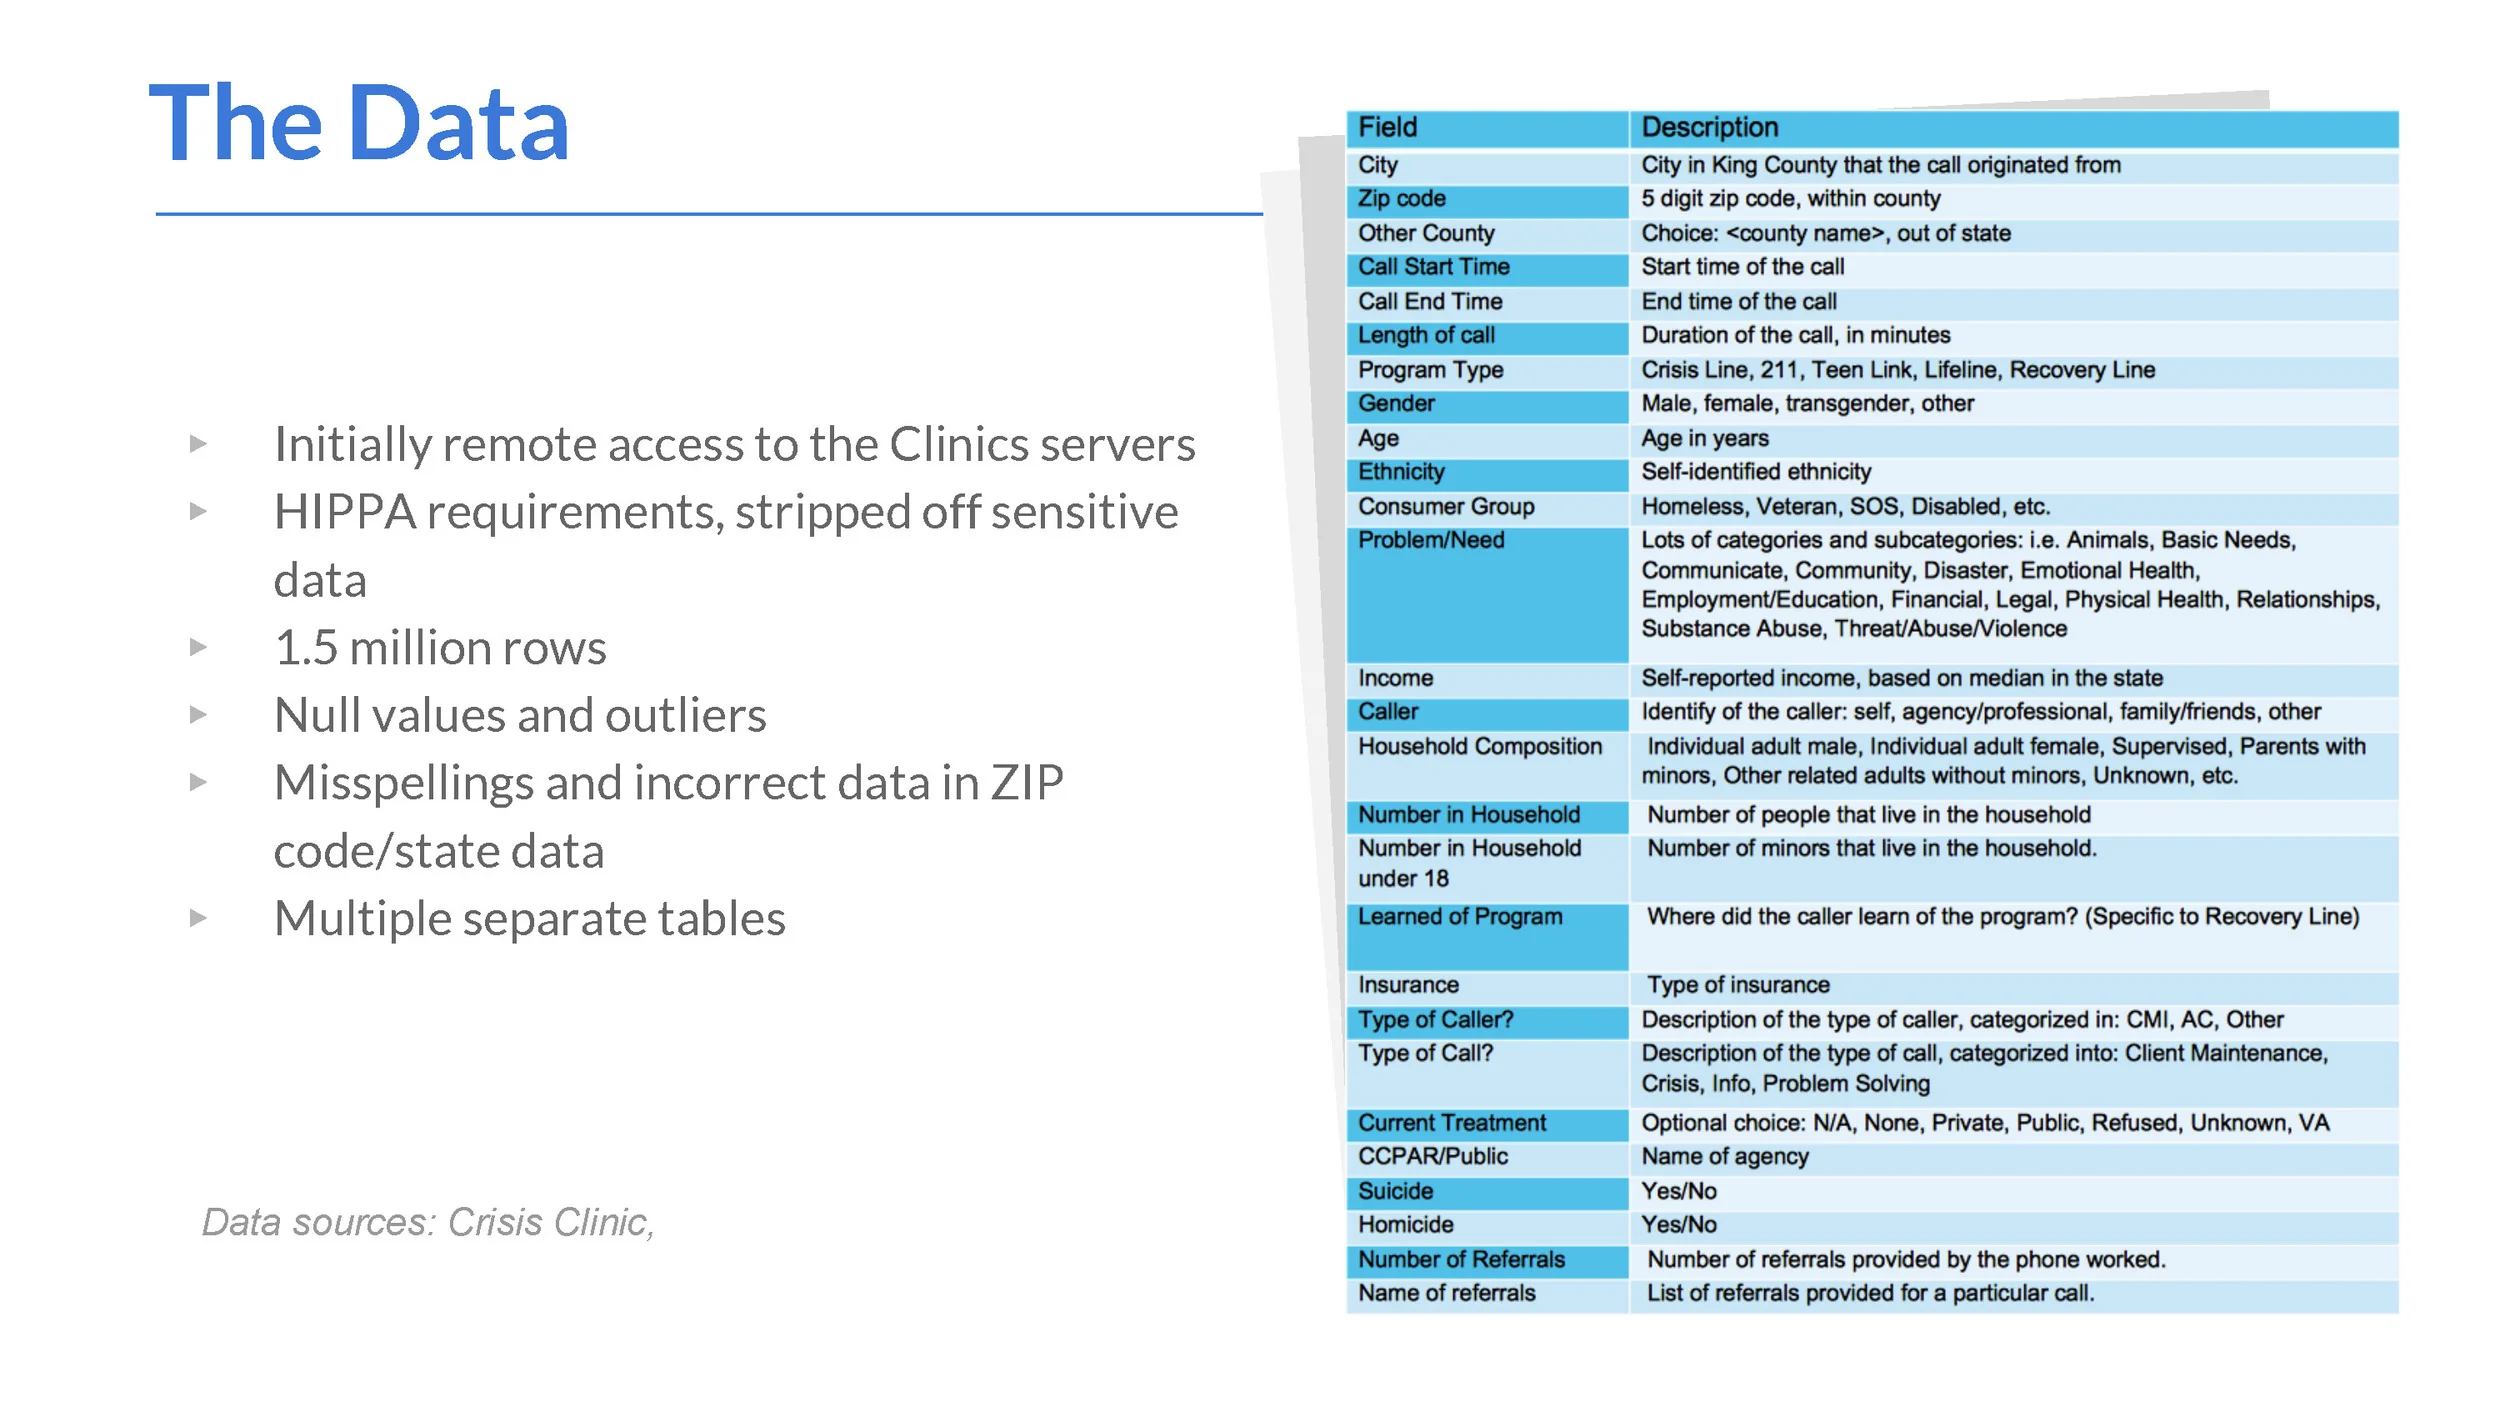
We were engaged with the process of data processing throughout the project as we were uncovering new requirements through our usability studies. To incorporate these, we had to consider defining new variables that the users were interested in and manipulate and clean data accordingly.
FINAL DASHBOARD
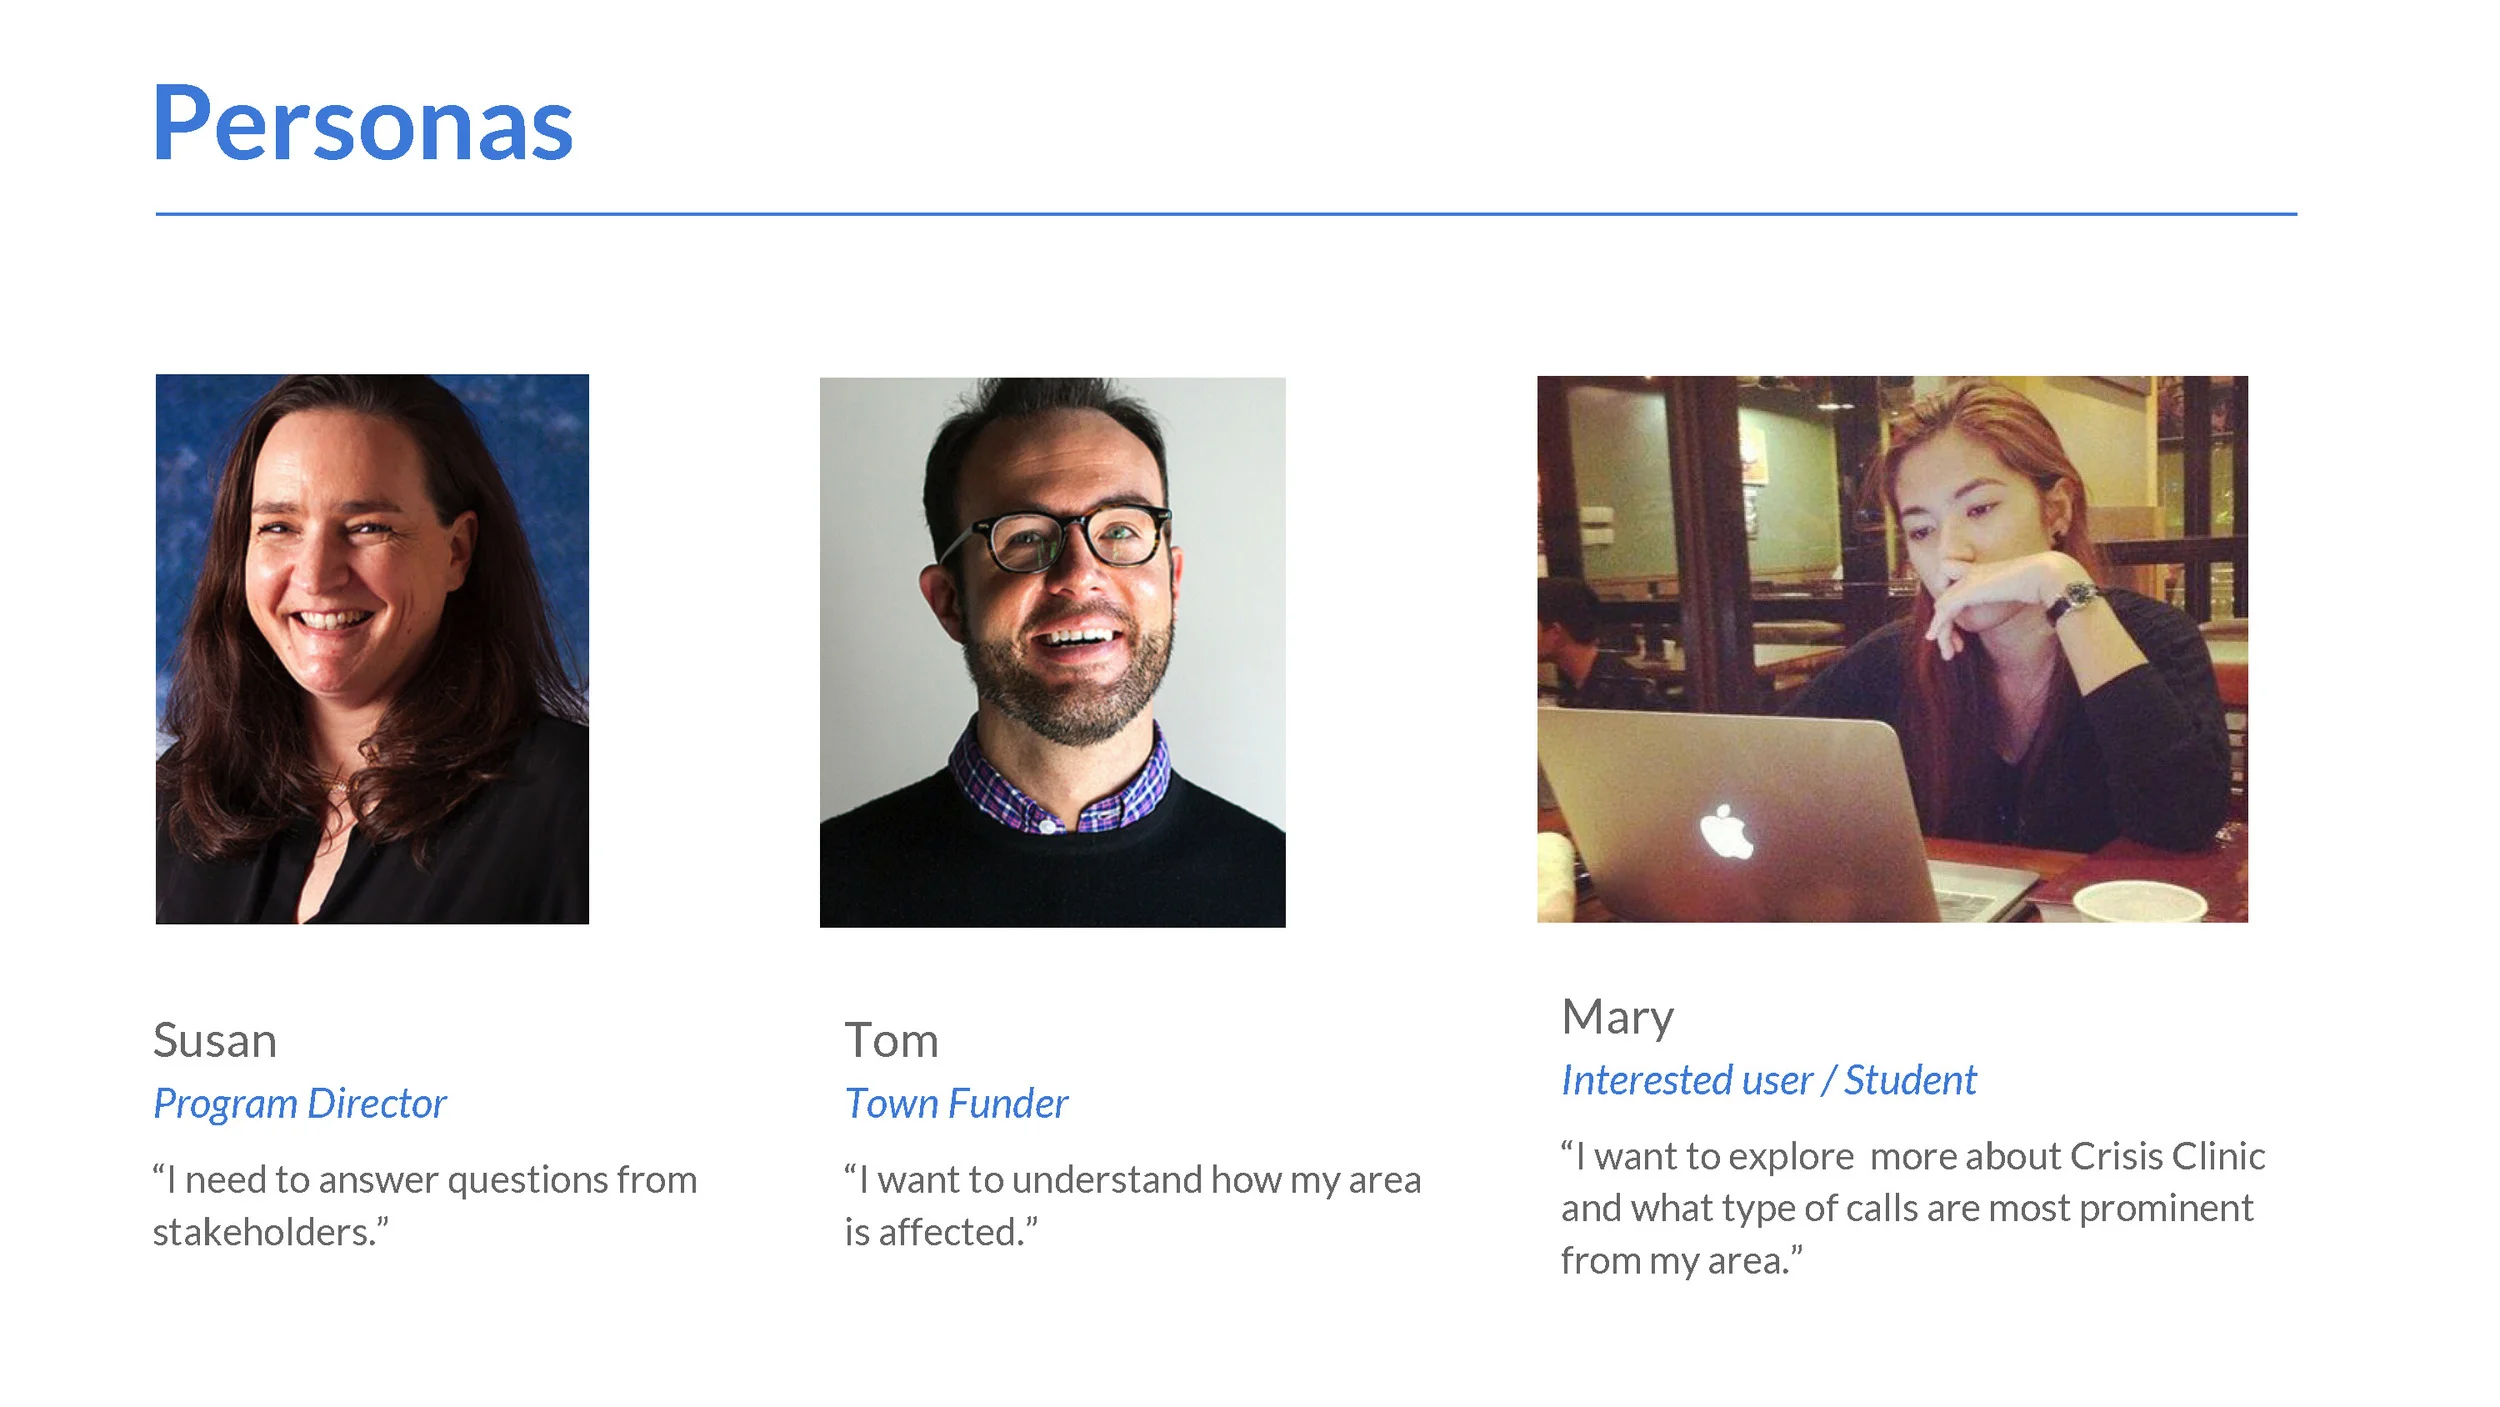
Our final deliverable consists of an interactive dashboard that allows the main personas i.e. the program directors, the fundraisers, and general interested users to answer the following kinds of questions. (interactive dashboard can be found here.)
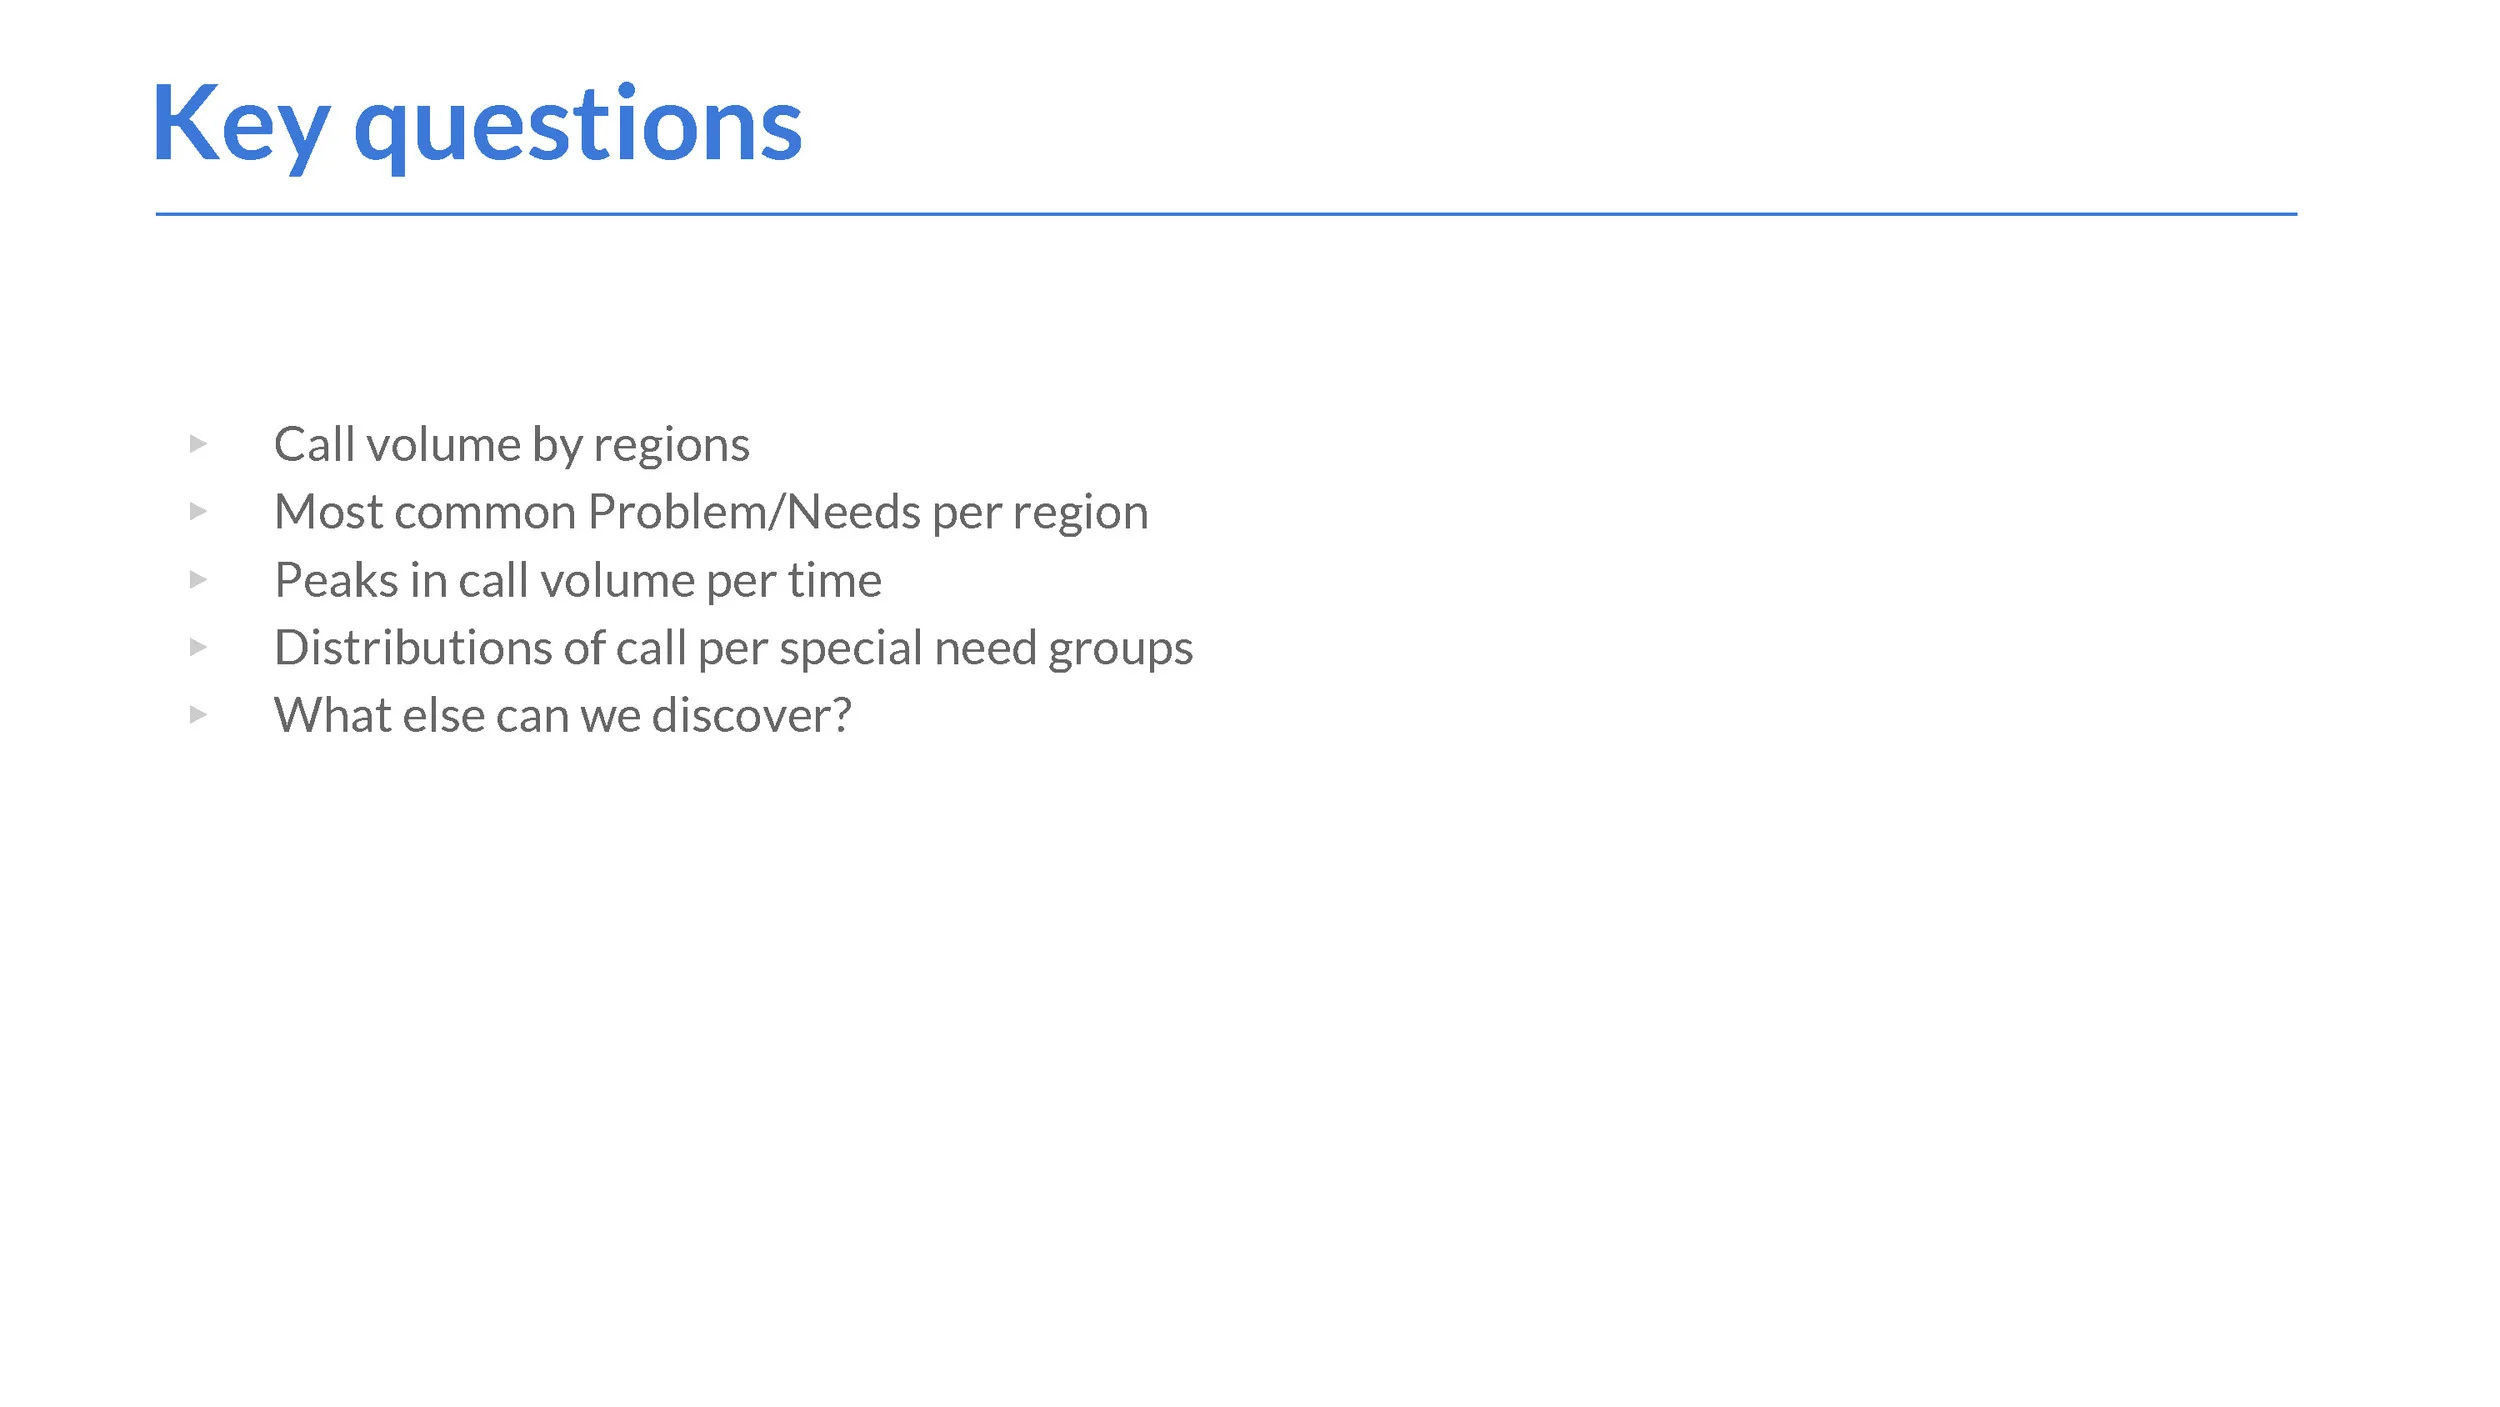
- What is the distribution of calls by ZIP code? Do certain regions have more types of calls then others?
- What is the distribution of calls per special needs consumer groups (i.e. ESL, homeless, veteran)
- What are top 20 program needs per ZIP code? Per City?
- How do call volumes change over time, both in general and for specific problems/needs, programs, and groups.
There are three categories of visualizations that we used to accomplish these tasks:
1. An interactive visualization of a choropleth map that shows distribution of calls per region encoded by color intensity. Selecting a region will allow the user to view related graphs that show distributions of types of calls as per different problems/needs category.
2. A time series visualization that shows the number of calls reported over a period of four years from 2010 to 2014.
3. A bar chart that ranks Problem/Needs reported and provides detail on demand information about the problem area, program, % of calls, and number of calls.